Most digital marketers check their Facebook ad performance the same way: log into Ads Manager, squint at rows of numbers, export to a spreadsheet, cross-reference with Google Analytics, then repeat the process tomorrow hoping something meaningful emerges. By the time you've pieced together what's working, you've already spent another $500 on underperforming campaigns.
The problem isn't that you lack data. Meta provides mountains of it. The problem is that scattered metrics across multiple interfaces don't tell you what to do next. You're collecting information, not extracting intelligence.
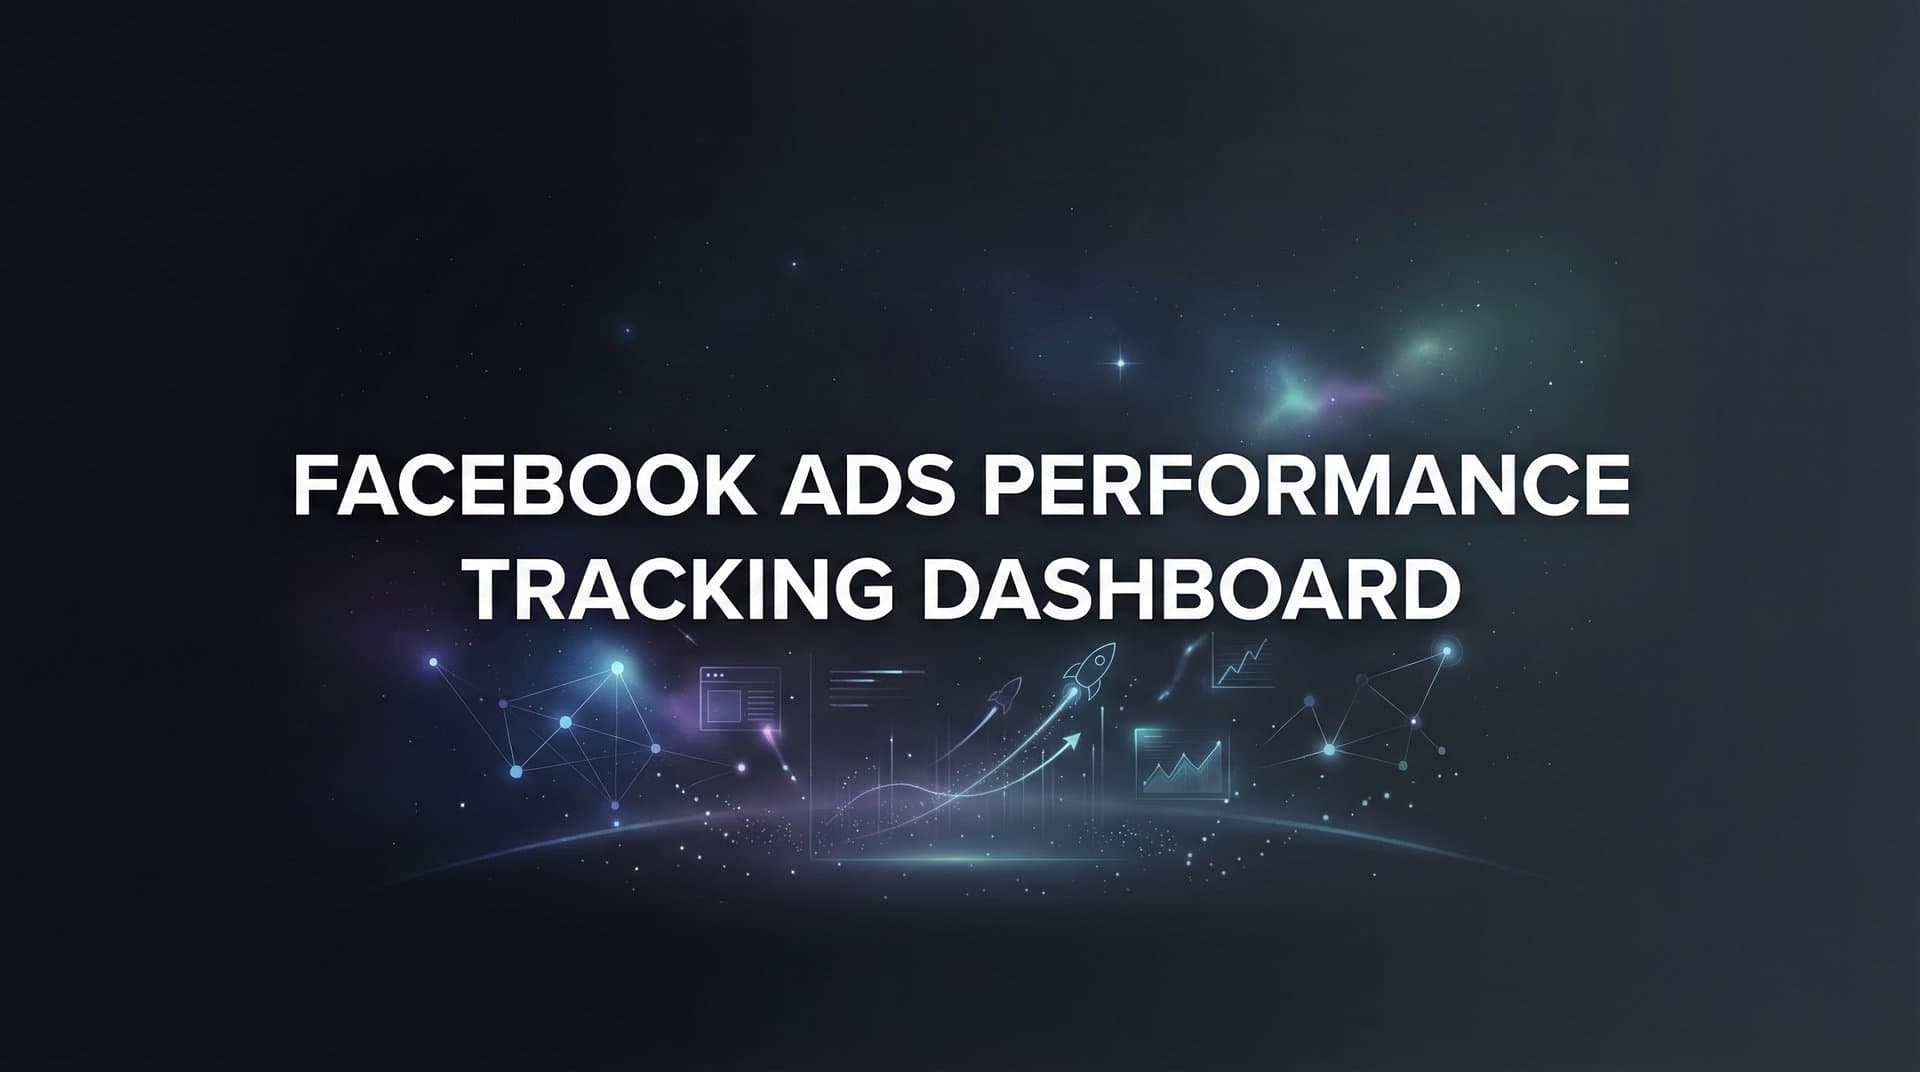
A Facebook ads performance tracking dashboard changes this dynamic entirely. Instead of hunting for insights across fragmented tools, you get centralized visibility into what's actually driving results—and more importantly, what's quietly draining your budget. This isn't about prettier graphs. It's about compressing the time between seeing a problem and fixing it, between spotting an opportunity and scaling it.
Why Scattered Data Kills Your Ad Performance
Here's what happens when you're toggling between Meta's native tools, attribution platforms, and spreadsheets: you miss the optimization window. That ad set burning through budget at $8 per conversion when your target is $4? You might not catch it until the weekly review. That creative hitting 4% CTR while everything else hovers at 1.2%? By the time you notice and scale it, audience fatigue has already set in.
The hidden cost of fragmented tracking isn't just wasted ad spend. It's the compounding effect of delayed decisions. Every hour you spend assembling data manually is an hour competitors are optimizing. Every campaign you let run without real-time visibility is a bet that nothing significant will change—a bet you'll lose more often than you win.
Modern Meta advertising has evolved into a complexity beast. You're not just running "a Facebook campaign" anymore. You're managing multiple placements (Feed, Stories, Reels, Audience Network), testing audience variations, rotating creative assets, and trying to make sense of how all these moving parts interact. One campaign might contain 20+ ad sets, each with 5-10 creative variations. That's 100-200 individual data points to monitor.
Without centralized visibility, you default to surface-level analysis. You check overall campaign spend and ROAS, maybe glance at top-level CTR, then hope for the best. Meanwhile, buried three levels deep, one ad set is delivering 3× better results than everything else—and you're splitting budget equally across all of them. Understanding Facebook ads campaign hierarchy becomes essential when managing this complexity.
This reactive approach—reviewing performance after the fact, making adjustments based on historical data, waiting to see if changes work—creates a perpetual lag between reality and response. The shift to proactive performance management happens when you have a unified dashboard that surfaces what matters, when it matters, in a format that tells you what to do about it.
The Architecture of Intelligent Performance Tracking
Not all dashboards are created equal. Many are glorified reporting tools that display the same metrics you'd see in Ads Manager, just in a different arrangement. That's not performance tracking. That's data relocation.
An effective Facebook ads performance tracking dashboard starts with real-time data synchronization. "Real-time" here means actual API-level integration that pulls fresh data continuously, not exports you run manually or scheduled reports that arrive hours after campaigns shift. When performance changes, you need to know immediately, not during tomorrow's review.
The foundation is customizable KPI views that align with your specific business goals. A lead generation campaign cares about cost per lead and lead quality indicators. An e-commerce campaign tracks ROAS and customer acquisition cost. A brand awareness push monitors reach and frequency. Your dashboard should let you define what success looks like for each campaign type and surface those metrics prominently.
Campaign-level drill-downs matter because aggregate data hides the truth. Overall ROAS might look acceptable at 3.2×, but that number masks the reality: two ad sets are delivering 6× returns while eight others barely break even. You need the ability to click through from campaign overview to ad set performance to individual creative analysis without switching tools or losing context. A robust Facebook ads analytics platform makes this seamless.
Trend visualization transforms static numbers into stories. A line graph showing CTR declining over 14 days tells you about creative fatigue. A spike in cost per result coinciding with a budget increase reveals scaling issues. Seeing patterns over time helps you distinguish normal fluctuation from meaningful shifts that demand action.
But here's where most dashboards stop—and where the real opportunity begins. The difference between a vanity metrics dashboard and an action-oriented performance tracking system is the intelligence layer. Raw data answers "what happened." Intelligent dashboards answer "what should I do about it."
AI-powered scoring systems evaluate performance against your custom goals and prioritize what needs attention. Instead of scanning 50 campaigns yourself, the dashboard identifies the three underperformers dragging down overall results and the two outperformers ready to scale. It doesn't just show you frequency is climbing; it flags when frequency crosses the threshold where performance typically degrades based on historical patterns.
This transforms your relationship with data. You're no longer an analyst sifting through reports. You're a decision-maker receiving prioritized intelligence. The dashboard does the heavy lifting of pattern recognition, anomaly detection, and performance comparison. You do what humans do best: strategic thinking and creative problem-solving.
The Metrics That Actually Matter
Every marketer knows to check CTR and CPC. Most are tracking the wrong things.
Click-through rate tells you if your creative captures attention. Cost per click tells you what you're paying for that attention. Neither tells you if those clicks convert into business results. A 5% CTR sounds impressive until you realize it's attracting curiosity-seekers who bounce immediately, while your 1.2% CTR ad is bringing in qualified buyers.
Cost per result is your north star metric, but "result" must be defined correctly. If you're optimizing for link clicks when what you actually want is purchases, you'll scale campaigns that drive traffic but not revenue. Your dashboard should track cost per your actual conversion goal—lead, purchase, signup, whatever drives business value—not Meta's default optimization event. Many marketers struggle with Facebook ads data analysis challenges precisely because they're measuring the wrong outcomes.
Frequency deserves more attention than most marketers give it. This metric reveals how many times the average person sees your ad. Below 2, you're building awareness. Between 2-4, you're in the sweet spot for conversion. Above 5, you're likely annoying people and watching performance degrade. Many campaigns that "stopped working" simply hit frequency fatigue while marketers were focused on CTR.
Quality ranking, engagement rate ranking, and conversion rate ranking are Meta's way of telling you how your ads compare to others competing for the same audience. Low rankings mean you're paying a premium for inferior performance. These metrics flag creative problems before they destroy your economics. If your quality ranking is "below average," no amount of budget optimization will fix it. You need better creative.
Attribution windows determine what your dashboard shows you, which means your entire understanding of performance depends on this setting. A 1-day view attribution window only counts conversions that happen within 24 hours of someone clicking your ad. A 7-day window captures more of the actual impact, especially for considered purchases. Proper Meta ads attribution tracking setup literally determines whether you see success or failure.
Leading indicators predict problems before they tank your results. Rising frequency, declining relevance scores, increasing cost per result over consecutive days—these signal trouble ahead. Lagging indicators like total spend and overall ROAS tell you what already happened. Effective dashboards emphasize leading indicators so you catch issues while there's still time to fix them.
The most sophisticated tracking goes beyond Meta's reported metrics to connect advertising performance with actual business outcomes. Post-iOS privacy changes mean Meta's attribution isn't always complete. Integrating your dashboard with attribution platforms that track the full customer journey reveals the real impact of your ads, including view-through conversions and multi-touch attribution that Meta can't see.
Turning Insights Into Optimization Moves
Data without action is just expensive entertainment. The value of a performance tracking dashboard is measured by the decisions it enables, not the charts it displays.
When cost per result exceeds your target by 30% for three consecutive days, that's a kill signal. Not a "let's watch it" signal. A kill signal. The campaign or ad set isn't going to magically improve. Cut it, analyze why it failed, and reallocate budget to what's working. Your dashboard should make these kill decisions obvious and immediate.
Scaling decisions require more nuance. An ad set delivering 5× ROAS at $100 daily budget looks like a winner, but increasing to $1,000 per day might push you into audience saturation where performance craters. Smart scaling means monitoring frequency and cost per result as you increase spend. If both remain stable through a 50% budget increase, you have room to scale further. If frequency jumps or efficiency degrades, you've found your ceiling. Learning scaling Facebook ads without increasing workload requires this kind of systematic approach.
Iteration signals come from creative performance patterns. When multiple ads using similar hooks or visuals underperform while a different approach crushes it, that's not random. Your audience is telling you what resonates. Use dashboard insights to identify winning creative elements—specific headlines, images, value propositions—then build your next campaign around those proven components.
Historical performance patterns are your crystal ball for future campaigns. If your dashboard shows that video ads consistently outperform static images for cold audiences, start with video next time. If carousel ads drive lower cost per lead than single images, make carousels your default format. You're not guessing anymore. You're building on evidence. Leveraging Facebook ads historical data utilization transforms past campaigns into future advantages.
The feedback loop is where compounding returns happen. Each campaign generates data. Your dashboard reveals what worked and what didn't. You apply those learnings to the next campaign. That campaign performs better because it's informed by actual results, not assumptions. It generates more insights. You get smarter with every iteration. Over time, this creates a massive advantage over competitors still guessing.
This is why platforms that integrate performance tracking with campaign building are so powerful. When your dashboard insights automatically inform your next campaign structure, creative selection, and audience targeting, you eliminate the translation gap between analysis and execution. The system learns what works for your specific business and continuously optimizes toward those patterns.
Building Your Performance Tracking Rhythm
The right dashboard with the wrong review cadence still fails. You need a structured workflow that matches campaign dynamics with decision-making speed.
Daily check-ins focus on active campaigns with meaningful spend. You're looking for anomalies and opportunities that can't wait until the weekly review. Did cost per result spike overnight? Is a new ad set dramatically outperforming expectations? Are you approaching budget caps that need adjustment? This isn't deep analysis. It's a 10-minute scan for anything that demands immediate action.
Weekly reviews dig deeper into performance trends. This is when you analyze what's working across campaigns, identify patterns in creative performance, and make strategic adjustments to budget allocation and audience targeting. You're comparing week-over-week results, assessing whether optimizations from last week improved performance, and planning tests for the coming week. The right Facebook ads campaign management software makes these reviews efficient rather than exhausting.
Monthly analysis zooms out to strategic questions. Are you hitting overall ROAS targets? Which campaign types deliver the best efficiency? What creative themes consistently win? Where should you increase or decrease overall investment? Monthly reviews inform budget planning and strategic direction, not tactical optimizations.
The cadence shifts based on campaign type and spend level. A $10,000 daily spend campaign demands multiple daily check-ins. A $500 monthly awareness campaign might only need weekly attention. Your dashboard should let you set alert thresholds so you're notified when campaigns need attention rather than checking everything constantly.
Integrating dashboard insights with bulk testing strategies accelerates learning. Instead of launching one ad variation, analyzing results, then launching another, you test multiple variations simultaneously and let the dashboard reveal winners quickly. This rapid iteration approach—made possible by clear performance visibility—compresses months of traditional testing into weeks. Tools that let you launch multiple Facebook ads at once amplify this advantage.
The biggest workflow mistake is analysis paralysis. You spot an underperforming campaign, but instead of acting, you dig deeper into the data trying to understand exactly why it's underperforming. Meanwhile, it keeps spending. Perfect understanding isn't required for action. If something isn't working and the dashboard makes that clear, pause it. You can analyze the why after you've stopped the bleeding.
Another common trap is over-optimization. Checking your dashboard every hour and making constant tiny adjustments prevents campaigns from stabilizing enough to generate meaningful data. Meta's algorithm needs time to learn and optimize. Give campaigns at least 48 hours before making significant changes unless something is catastrophically wrong.
Your Dashboard Action Plan
Start by auditing your current tracking setup. What tools are you using? How much manual work is required to see performance across all campaigns? How long does it take you to identify what needs optimization? If the answer is "more than 10 minutes," you're losing money to inefficiency.
Define your success metrics clearly. What does a winning campaign look like for your business? Not industry benchmarks—your specific targets based on your economics. Cost per acquisition, return on ad spend, lead quality scores, customer lifetime value. Your dashboard should be built around these metrics, not generic KPIs.
Ensure real-time data integration. If you're exporting CSV files or waiting for scheduled reports, you're making decisions on stale information. API-level integration with Meta means your dashboard reflects current performance, enabling faster responses to both problems and opportunities. A secure Facebook ads API connection is the foundation of reliable real-time tracking.
Set up intelligent alerts for the metrics that matter most. When cost per result exceeds your target, when frequency climbs above 5, when a new campaign's performance diverges significantly from projections—you want automatic notifications, not surprises during your next review.
Consider how AI-powered platforms can eliminate the gap between insight and action. Traditional dashboards show you data and leave the interpretation and response to you. AI-assisted systems analyze performance patterns, identify optimization opportunities, and in advanced cases, can automatically implement improvements based on what's working. Exploring what is Facebook ads automation reveals how these systems transform campaign management. This isn't about removing human judgment—it's about augmenting it with machine pattern recognition at a scale and speed humans can't match.
The evolution from manual tracking to intelligent automation represents a fundamental shift in how effective marketers operate. You're not just getting better reports. You're getting a system that learns from every campaign, identifies winning patterns, and helps you build on what works rather than constantly reinventing your approach.
The Command Center Advantage
A Facebook ads performance tracking dashboard isn't a luxury tool for data nerds. It's the difference between reactive firefighting and proactive optimization, between guessing what might work and knowing what does work, between managing campaigns and commanding them.
The marketers winning in today's competitive landscape aren't necessarily the most creative or the biggest spenders. They're the ones who see problems first, scale winners faster, and compound learnings across every campaign. That advantage comes from unified visibility combined with intelligent analysis that transforms scattered data into clear action.
Your current tracking setup is either accelerating your decision-making or slowing it down. There's no neutral position. Every hour spent assembling data manually is an hour not spent optimizing. Every insight that takes days to surface is an opportunity lost to faster competitors.
The gap between seeing performance data and acting on it determines your results more than any other factor. Close that gap, and everything else—creative testing, audience refinement, budget optimization—becomes exponentially more effective because you're building on a foundation of real intelligence rather than delayed intuition.
Ready to transform your advertising strategy? Start Free Trial With AdStellar AI and be among the first to launch and scale your ad campaigns 10× faster with our intelligent platform that automatically builds and tests winning ads based on real performance data.