You're three weeks into a Facebook campaign that started strong. Week one delivered a 4.2x ROAS. Week two held steady at 3.8x. Then week three hits, and suddenly you're watching your cost per acquisition climb 40% while your conversion rate drops like a stone. Your first instinct? Panic-tweak everything—bump the budget, swap out creative, broaden the audience. But here's the brutal truth: random optimization attempts usually make things worse, not better.
This scenario plays out thousands of times daily across Facebook Ads Manager dashboards worldwide. Campaign performance doesn't decline because you did something wrong initially—it declines because that's what campaigns do. Audience fatigue sets in. Creative loses its punch. The algorithm exhausts your best-performing segments. What separates consistently profitable advertisers from those stuck in the feast-or-famine cycle isn't luck or bigger budgets—it's systematic optimization methodology.
Most marketers treat Facebook campaign optimization like firefighting: reactive, chaotic, and driven by whatever metric looks worst today. They change multiple variables simultaneously, making it impossible to identify what actually moved the needle. They lack baseline data to measure improvement against. They optimize based on gut feeling rather than statistical significance. The result? Campaigns that limp along at mediocre performance or, worse, spiral into unprofitability despite constant "optimization" efforts.
This guide walks you through the exact framework that transforms underperforming campaigns into consistent profit machines. You'll learn how to diagnose performance bottlenecks systematically, optimize audiences with precision rather than guesswork, engineer creative testing that produces scalable winners, and leverage AI automation to multiply your optimization capacity. By the end, you'll have a repeatable methodology that works whether you're managing a single campaign or an entire portfolio.
The difference between random tweaking and systematic optimization is the difference between hoping for better results and engineering them. Let's walk through how to do this step-by-step.
The Performance Diagnostic Deep Dive
Before you touch a single campaign setting, you need data. Not gut feelings about what might be wrong—actual performance data that reveals where your campaign is bleeding money. Most optimization attempts fail because marketers skip this diagnostic phase and jump straight to random tweaks. They're essentially performing surgery blindfolded.
The foundation of systematic optimization is establishing your performance baseline. You need at least 1,000 impressions and 50 clicks per ad set to make statistically reliable decisions. Anything less, and you're optimizing based on noise rather than signal. If you're new to how to run facebook ads, establish solid foundational setup before attempting systematic optimization—proper campaign structure determines whether your diagnostic data will be meaningful or misleading.
Start with your metrics hierarchy. Not all metrics matter equally, and chasing the wrong ones wastes time and budget. Your primary metric should align with your campaign objective—ROAS for conversion campaigns, cost per lead for lead generation, CPM and CTR for awareness plays. For a broader perspective on optimization across Meta's entire advertising ecosystem, explore proven meta ads optimization strategies that apply these diagnostic principles at scale.
Here's your systematic audit process: Export the last 30 days of campaign data from Ads Manager. While manual analysis provides essential insights, AI tools for campaign management can automate much of this diagnostic process and identify optimization opportunities that human analysis might miss. Break down performance by ad set, then by individual ad. Look for patterns—which audiences are driving results? Which creative elements are resonating? Where is frequency climbing above 3.0, signaling audience fatigue?
Campaign Health Assessment Framework: Compare your current metrics against your baseline. If your CPC has increased 25% or more, you have an efficiency problem. If CTR has dropped below 1% (or below your industry benchmark), your creative or targeting needs work. If conversion rate is declining while traffic holds steady, your landing page or offer may be the bottleneck—not your Facebook campaign at all.
Bottleneck Identification Matrix: Performance issues fall into three categories. Audience-level problems show up as high frequency (above 3.5), rising CPMs, and declining relevance scores. Creative-level issues manifest as dropping CTR and engagement rates while reach remains stable. Technical problems—tracking errors, attribution issues, bidding strategy mismatches—show up as conversion discrepancies between Facebook and your analytics platform.
Document everything in a simple spreadsheet. Record your current ROAS, CPC, CTR, conversion rate, and frequency for each ad set. This snapshot becomes your baseline for measuring whether your optimization efforts actually work. Too many marketers make changes without recording what performance looked like before—then they can't tell if their tweaks helped or hurt.
The diagnostic phase isn't glamorous, but it's the difference between strategic optimization and expensive guesswork. Once you know exactly where your campaign is underperforming, you can apply targeted fixes instead of hoping random changes somehow improve results.
Audience Precision Engineering
Your campaign data just revealed something critical: 68% of your conversions come from just 23% of your audience segments. This isn't unusual—it's the pattern hiding in almost every Facebook campaign. Most advertisers spread budget evenly across broad audiences, essentially subsidizing poor performers with profits from winners. Systematic audience optimization flips this equation by identifying your highest-performing segments and engineering expansion strategies that maintain performance while scaling reach.
The foundation of audience precision starts with performance-driven analysis. Open your Ads Manager and break down results by age, gender, location, and placement. You're looking for segments that deliver 30% or better performance than your campaign average. A 35-year-old male audience converting at $12 CPA while your campaign average sits at $18? That's your expansion blueprint. Geographic clusters showing 2x higher conversion rates? Those reveal untapped scaling opportunities in similar markets.
Beyond demographic targeting, facebook ads custom audiences allow you to leverage your existing customer data and website visitors for precision targeting that significantly improves campaign performance. Audience Insights reveals interest and behavior patterns within your top performers—the pages they like, the content they engage with, the purchase behaviors they exhibit. This isn't demographic guessing; it's reverse-engineering success patterns from actual conversion data.
Device and placement performance correlation matters more than most advertisers realize. If your mobile feed placements convert at half the cost of desktop, that's not just interesting data—it's a strategic directive to shift budget allocation and potentially create mobile-specific creative. Placement analysis often reveals that 70% of your budget goes to placements generating 40% of your results. Systematic optimization reallocates based on performance, not Facebook's default distribution.
Strategic Audience Expansion Framework
Once you've identified your winning audience characteristics, expansion requires methodology, not guesswork. Lookalike audiences built from your conversion data represent Facebook's algorithm finding users who match your best customers' behavioral patterns. But here's where most advertisers fail: they create a single 10% lookalike and wonder why performance tanks.
The systematic approach creates tiered lookalikes—1%, 2%, and 5% audiences—then tests them as separate ad sets with identical creative and budget. Your 1% lookalike typically delivers the strongest performance because it represents the closest match to your conversion data. As you expand to 2% and 5%, you're trading precision for reach. Understanding when to scale ad campaigns is crucial—premature scaling can waste budget, while delayed scaling leaves money on the table. Use performance data to identify the optimal scaling moment.
Test your 1% lookalike first. Once it demonstrates stable performance over 7-10 days and at least 50 conversions, layer in your 2% audience. If the 2% maintains 80% or better of your 1% performance, you've validated expansion potential. The 5% lookalike becomes viable only when you've exhausted reach in tighter audiences—typically when frequency climbs above 3.0 and performance starts declining.
Interest expansion follows similar logic but requires more precision. If your winning audience shows strong affinity for specific pages or interests, don't just add random related interests. Test narrow interest stacks against each other in separate ad sets. This methodical approach reveals which specific interest combinations drive performance rather than hoping broad targeting somehow works out.
Creative Performance Optimization Engine
Your audience targeting might be perfect, but if your creative is stale, your campaign bleeds money. Creative fatigue isn't a maybe—it's a when. The question isn't whether your ads will stop working, but whether you'll catch the decline before it tanks your profitability. Most advertisers notice creative fatigue only after their cost per acquisition has doubled. By then, you've already wasted thousands of dollars showing tired ads to an increasingly annoyed audience.
Systematic creative optimization means catching fatigue early and having fresh winners ready before performance drops. This requires monitoring specific indicators that signal when creative is losing effectiveness, not just waiting for obvious metrics like CTR to crater.
Creative Fatigue Detection and Analysis
Frequency is your early warning system. When the same people see your ad repeatedly, engagement drops predictably. At 2-3 frequency, most ads perform optimally. By 4-5 frequency, you're entering the danger zone. Above 6 frequency, you're essentially burning money showing ads to people who've already decided not to click.
But frequency alone doesn't tell the complete story. You need to analyze performance across creative elements systematically. Break down your ads by headline, primary text, image, and call-to-action. Which element is actually driving results? Most advertisers assume their clever headline is the winner when it's actually the image doing the heavy lifting. This misattribution leads to scaling the wrong elements.
Track engagement decline patterns over time. A winning ad typically shows consistent engagement for 7-14 days, then begins gradual decline. If your CTR drops 20% or more from peak performance, or your cost per click increases 30%+ while other variables remain constant, creative fatigue is your primary problem. Document these patterns because they reveal your creative lifecycle—how long your ads typically stay fresh before needing replacement.
Audience response patterns matter too. Are certain demographics engaging while others ignore your creative? Maybe your 25-34 age group loves your ad while 45-54 finds it irrelevant. This insight tells you whether you need different creative for different segments or whether your targeting needs refinement. Don't assume one creative works universally across your entire audience.
Systematic A/B Testing Implementation
Random creative testing wastes budget and produces unreliable results. Systematic testing means changing one variable at a time so you know exactly what moved the needle. Test headlines against each other while keeping images, copy, and CTAs identical. Then test images while keeping the winning headline constant. This single-variable methodology is slower but produces actionable insights you can scale.
Statistical significance requires patience most advertisers lack. You need at least 100 conversions per variation before declaring a winner. Anything less, and you're making decisions based on noise. If your daily conversion volume is low, extend your test duration rather than making premature calls. A "winning" creative with 15 conversions might just be lucky—scale it, and you'll discover it's actually a loser.
Budget allocation during testing determines reliability. Split your test budget evenly across variations. If you're testing three headlines, each gets 33% of budget. Uneven budget distribution skews results because the variation with more spend naturally generates more conversions, but that doesn't mean it's more efficient. Equal budget, equal opportunity to prove performance.
Winner identification requires clear criteria established before testing begins. Define your success metric—is it CTR, conversion rate, or cost per conversion? Set a minimum performance threshold: "The winner must beat the control by at least 15% and maintain that advantage for 7 days." Without predetermined criteria, you'll cherry-pick results that confirm your biases rather than identifying genuine winners.
Campaign Lifecycle Management: Adapting Your Optimization Strategy
Here's what most advertisers miss: the optimization tactics that rescued your campaign in week three will kill your performance in week eight. Facebook campaigns don't just decline over time—they evolve through distinct lifecycle stages, each requiring fundamentally different optimization approaches. Treating a mature campaign like a fresh launch is like trying to fix a broken bone with aspirin. Wrong diagnosis, wrong treatment, wasted resources.
The campaign lifecycle breaks into four distinct phases, each with unique performance characteristics and optimization requirements. Understanding where your campaign sits in this lifecycle determines whether you should be scaling aggressively, refining targeting, refreshing creative, or preparing for retirement.
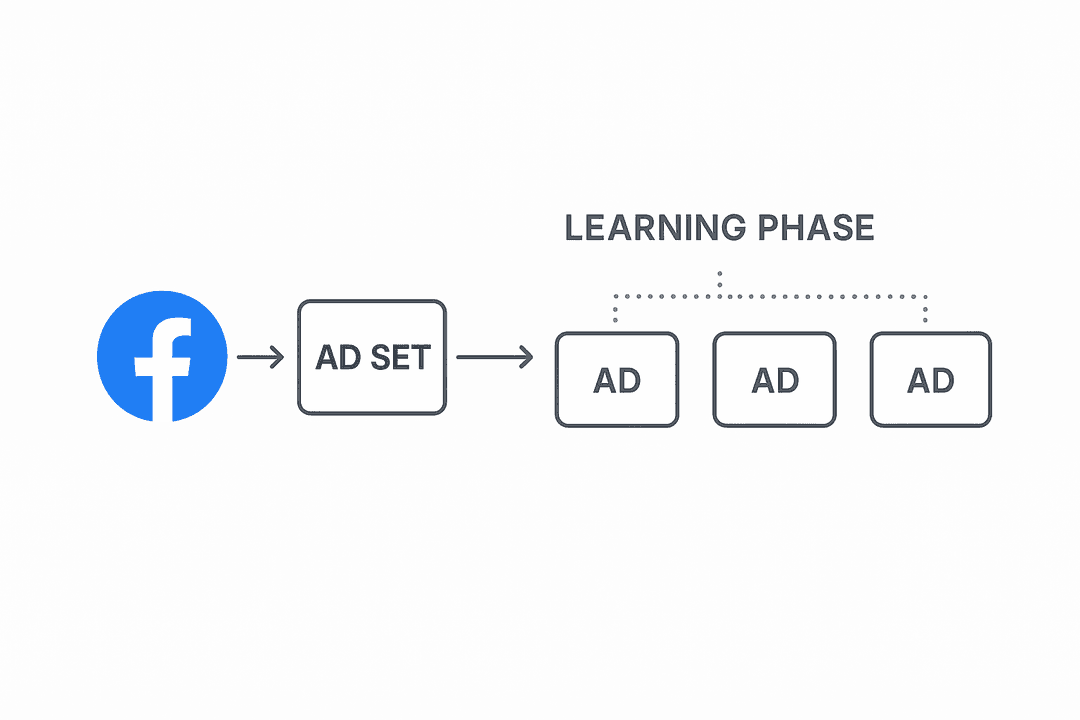
The Learning Phase: Days 1-7
During the first week, Facebook's algorithm is essentially conducting reconnaissance. It's testing your ads across audience segments, placements, and times of day to identify where performance peaks. Your job during this phase isn't optimization—it's patience and data collection.
What to Monitor: Track delivery status, ensure your pixel is firing correctly, and watch for any technical issues that could corrupt learning. Check that your campaign is exiting the learning phase (Facebook needs about 50 conversion events per week to complete learning).
What NOT to Do: Don't make budget changes, don't pause ad sets, don't edit targeting. Every significant change resets the learning phase, forcing the algorithm to start over. Advertisers who can't resist tweaking during this phase trap themselves in perpetual learning mode, never allowing the algorithm to optimize delivery.
The Growth Phase: Weeks 2-4
Your campaign has exited learning and is delivering consistent results. This is your scaling window—the brief period where you can increase budgets and expand reach while maintaining efficiency. Miss this window, and you'll struggle to scale profitably.
Optimization Focus: Identify your best-performing ad sets and scale budgets by 20-30% every 3-4 days. Launch lookalike audiences based on your converters. Test creative variations to find additional winners before your current ads fatigue. This is when bulk campaign launch capabilities become valuable—you can rapidly test multiple audience and creative combinations to identify scalable winners before the growth window closes.
Warning Signs: If frequency climbs above 3.0 or your cost per conversion increases 20%+ despite scaling, you're approaching the maturity phase. Prepare creative refreshes and audience expansion strategies now, before performance drops.
The Maturity Phase: Weeks 5-8
Performance has plateaued or begun declining. Your audience has seen your ads multiple times. The algorithm has exhausted your highest-intent segments. This is where most campaigns die—not because they failed, but because advertisers don't recognize that maturity requires different optimization tactics than growth.
Optimization Focus: Creative refresh becomes priority one. Launch new ad variations with different hooks, images, and messaging angles. Expand to broader audiences—your 2% and 5% lookalikes, wider interest targeting, or geographic expansion. Consider automated instagram ads to extend your reach across Meta's platform ecosystem without starting from scratch.
Ready to transform your advertising strategy? Get Started With AdStellar AI and be among the first to launch and scale your ad campaigns 10× faster with our intelligent platform that automatically builds and tests winning ads based on real performance data.