You're staring at your ad dashboard at 11 PM. Again.
Campaign A is crushing it—conversions rolling in, cost per acquisition dropping. Campaign B? It's burning through your budget like a bonfire, and you can't figure out why. You've got 50+ metrics spread across Meta, Google, and LinkedIn, each platform telling you something different.
The real problem isn't lack of data. It's that you're drowning in it.
Most advertisers spend hours each week analyzing performance, toggling between dashboards, exporting spreadsheets, and second-guessing every decision. Should you increase that budget? Pause this audience? Test new creative? The uncertainty is exhausting, and every wrong move costs real money.
Here's what nobody tells you: ad performance analysis isn't about tracking more metrics. It's about having a systematic framework that tells you exactly what to look at, when to look at it, and what action to take.
Think of it like being a detective. You don't need to examine every fingerprint at a crime scene—you need to know which clues actually matter. The same applies to your ad data. Once you know the pattern to follow, analysis that used to take two hours shrinks to 15 minutes of focused work.
This guide walks you through a proven 7-step framework for analyzing ad performance with confidence. You'll learn which metrics actually drive decisions, how to spot winning patterns before they're obvious, and most importantly, how to turn raw data into clear action items.
By the end, you'll know exactly which campaigns deserve more budget, which audiences are wasting your spend, and which creative elements are secretly driving your best results. No more guessing. No more dashboard paralysis at midnight.
Let's walk through how to do this step-by-step.
Step 1: Connect Your Ad Platforms to a Central Dashboard
The first step in analyzing ad performance is consolidating your data. If you're running campaigns across Meta, Google Ads, and LinkedIn, you're probably switching between three different dashboards, each with its own metrics, terminology, and reporting format.
This fragmentation creates two major problems. First, you waste time manually comparing numbers across platforms. Second, you miss cross-platform insights that could dramatically improve your results.
Start by connecting all your ad platforms to a unified analytics dashboard. Tools like Google Analytics 4, Supermetrics, or dedicated ad management platforms can pull data from multiple sources into one view. This gives you a single source of truth for all your advertising performance.
When setting up your central dashboard, focus on standardizing your metrics. Different platforms use different names for similar concepts—Meta calls it "Cost per Result" while Google uses "Cost per Conversion." Create a consistent naming convention so you can compare apples to apples.
The goal here isn't just convenience. It's about seeing patterns that only emerge when you look at your entire advertising ecosystem together. You might discover that LinkedIn drives higher-quality leads even though Meta has a lower cost per click, or that Google Search campaigns work best for users who first saw your Meta ads.
Once your data is centralized, set up automated reporting so fresh numbers flow in daily. This eliminates manual data pulls and ensures you're always working with current information when making optimization decisions.
Step 2: Define Your Success Metrics Based on Business Goals
Before you can analyze whether your ads are performing well, you need to define what "well" actually means for your business. This is where most advertisers go wrong—they track vanity metrics that look impressive but don't connect to revenue.
Start by identifying your primary business objective. Are you trying to generate leads? Drive direct sales? Build brand awareness? Your objective determines which metrics actually matter. If you're running an e-commerce store, conversion rate and return on ad spend (ROAS) are critical. If you're building a SaaS business, cost per qualified lead and lead-to-customer conversion rate matter more.
Create a hierarchy of metrics with three levels. Your North Star metric sits at the top—this is the single number that best represents success for your business. For most businesses, this is either ROAS, cost per acquisition (CPA), or customer lifetime value to customer acquisition cost ratio (LTV:CAC).
Below that, identify 3-5 secondary metrics that influence your North Star. These might include click-through rate, conversion rate, average order value, or cost per click. These metrics help you diagnose why your North Star is moving up or down.
At the bottom level, track diagnostic metrics that explain changes in your secondary metrics. This includes things like impression share, quality score, audience overlap, and creative engagement rates.
Understanding how to create effective ad strategies starts with aligning your metrics to business outcomes. Without this foundation, you'll optimize for the wrong things and waste budget on campaigns that don't drive real results.
Document your metric definitions and thresholds. What ROAS do you need to be profitable? What CPA makes a campaign worth scaling? Having these numbers written down prevents emotional decision-making when you're reviewing performance at midnight.
Step 3: Segment Your Data by Campaign, Audience, and Creative
Looking at overall account performance tells you almost nothing useful. The real insights come from breaking down your data into meaningful segments that reveal what's actually working.
Start with campaign-level segmentation. Group campaigns by objective (awareness, consideration, conversion), funnel stage (top, middle, bottom), or product line. This lets you see which types of campaigns are delivering the best results and where you should allocate more budget.
Next, segment by audience. Compare performance across different demographic groups, geographic locations, device types, and custom audiences. You'll often find that a campaign that looks mediocre overall is actually crushing it with one specific audience while failing with others.
Creative segmentation is where most advertisers find their biggest opportunities. Break down performance by ad format (video vs. image vs. carousel), messaging angle (problem-focused vs. solution-focused), and visual style. This reveals which creative elements resonate with your audience and which fall flat.
For businesses managing multiple campaigns at scale, ppc automation tools can automatically segment and analyze performance across hundreds of variations, surfacing insights that would take hours to find manually.
Create comparison views that put your segments side by side. Don't just look at absolute numbers—calculate relative performance. A campaign with a $50 CPA might seem expensive until you realize your average CPA is $75, making this campaign a winner worth scaling.
Pay special attention to segments with small sample sizes. A campaign with 10 conversions might show a great CPA, but it's too early to draw conclusions. Set minimum thresholds for statistical significance before making major decisions based on segmented data.
Step 4: Analyze Performance Trends Over Time
A single day's data tells you almost nothing. A single week can be misleading. Real insights come from analyzing how your metrics change over time and understanding what drives those changes.
Start by establishing your baseline performance. Look at the past 30-90 days to understand your normal ranges for key metrics. What's your typical CPA? What conversion rate do you usually see? These baselines help you identify when something is genuinely wrong versus normal fluctuation.
Create time-series visualizations for your most important metrics. Line graphs showing daily or weekly trends reveal patterns that tables of numbers hide. You might notice that performance dips every weekend, spikes on Tuesdays, or gradually declines over the course of a month.
Look for correlations between different metrics over time. When your click-through rate increases, does your conversion rate go up or down? When you increase budget, does your CPA stay stable or rise? These relationships tell you how your ad account actually behaves, not how you think it should behave.
Compare current performance to previous periods. Year-over-year comparisons account for seasonality. Month-over-month comparisons show recent trends. Week-over-week comparisons catch immediate issues. Use all three perspectives to get a complete picture.
Document external factors that might explain performance changes. Did you launch a new product? Run a promotion? Change your landing page? Get mentioned in the press? These context clues help you separate signal from noise when analyzing trends.
Set up automated alerts for significant changes. If your CPA suddenly jumps 30% or your conversion rate drops below your baseline, you want to know immediately, not when you check your dashboard three days later.
Step 5: Identify Your Best and Worst Performers
Once you've segmented your data and analyzed trends, it's time to identify which specific campaigns, audiences, and creatives are driving results and which are wasting budget.
Create a performance matrix that plots your campaigns on two axes: volume (impressions, clicks, or conversions) and efficiency (CPA, ROAS, or conversion rate). This visual immediately shows you four categories: high-volume winners, low-volume winners, high-volume losers, and low-volume losers.
Your high-volume winners are your cash cows. These campaigns are spending significant budget and delivering strong results. Your primary goal with these is to maintain performance while cautiously testing budget increases to see if they can scale further.
Low-volume winners are your hidden gems. They're performing well but not spending much budget, usually because they're limited by audience size or you haven't allocated enough budget. These deserve more investment to see if they can become high-volume winners.
High-volume losers are your biggest problem. They're spending a lot of money while delivering poor results. These need immediate attention—either fix them quickly or pause them to stop the bleeding.
Low-volume losers are typically new tests that haven't worked out. These are easy decisions—pause them and move on. Don't let emotional attachment to a creative concept or audience hypothesis keep you spending on campaigns that clearly aren't working.
For advertisers running large-scale campaigns, bulk ad launcher tools can help you quickly deploy variations to test what works, while systematic analysis helps you identify winners faster.
Look beyond just campaign-level performance. Drill down to ad set and ad level to find specific elements driving success or failure. You might have a campaign that looks mediocre overall but contains one ad set with exceptional performance being dragged down by three poor performers.
Step 6: Diagnose Why Campaigns Are Succeeding or Failing
Identifying your best and worst performers is only half the battle. The real value comes from understanding why they're performing the way they are, so you can replicate success and avoid repeating failures.
Start with your winning campaigns. What do they have in common? Look at audience characteristics, creative elements, messaging angles, offers, and targeting parameters. Often you'll find patterns—maybe all your best campaigns target a specific age range, use video creative, or focus on a particular pain point.
For campaigns with strong click-through rates but poor conversion rates, the problem is usually message-match. Your ad is attracting attention, but your landing page isn't delivering on the promise. This is a landing page problem, not an ad problem.
For campaigns with poor click-through rates, the issue is usually creative or audience relevance. Either your ad isn't compelling enough to stand out in the feed, or you're showing it to people who don't care about your offer.
For campaigns with rising CPAs over time, you're likely experiencing audience fatigue. You've shown your ads to the same people too many times, and they're tuning you out. The solution is creative refresh or audience expansion.
Compare your performance to platform benchmarks for your industry. If your click-through rate is 2% and the industry average is 1.5%, your creative is working well. If your conversion rate is 1% and the industry average is 3%, you have a landing page or offer problem.
Understanding the difference between AI vs traditional advertising methods can help you diagnose performance issues faster, as AI-powered tools often surface patterns that manual analysis misses.
Document your findings in a simple framework: "When [condition], we see [result], because [reason]." For example: "When we target 25-34 year olds with video ads, we see 40% lower CPA, because this audience engages more with video content and has higher purchase intent."
Step 7: Create an Action Plan Based on Your Analysis
All the analysis in the world is worthless if you don't turn insights into action. This final step is about creating a clear, prioritized plan for optimizing your ad performance based on everything you've learned.
Start by categorizing your action items into three buckets: quick wins, scaling opportunities, and tests. Quick wins are changes you can make immediately that will improve performance—pausing losing campaigns, increasing budget on winners, or refreshing fatigued creative.
Scaling opportunities are campaigns or audiences that are working well at small scale and deserve more budget. Approach these carefully—not everything that works at $100/day will work at $1,000/day. Increase budgets gradually (20-30% at a time) and monitor performance closely.
Tests are new hypotheses you want to validate based on your analysis. Maybe you noticed that video ads outperform images, so you want to test video across more campaigns. Or you found that one audience segment converts exceptionally well, so you want to test similar audiences.
Prioritize your action items based on potential impact and ease of implementation. A change that could improve ROAS by 50% but requires three weeks of work ranks lower than a change that could improve ROAS by 20% but takes 10 minutes.
For teams looking to streamline campaign launches based on analysis insights, learning how to use AI to launch ads can dramatically reduce the time between insight and implementation.
Create a testing calendar that spreads out your experiments. Don't change everything at once, or you won't know what caused performance changes. Test one variable at a time, give each test enough time to reach statistical significance, and document your results.
Set up a regular review cadence. Weekly reviews for tactical optimizations (budget adjustments, pausing poor performers). Monthly reviews for strategic decisions (new campaign launches, major creative refreshes). Quarterly reviews for big-picture strategy (channel mix, overall budget allocation).
Finally, close the loop by tracking the impact of your optimizations. When you make a change based on your analysis, monitor whether it delivers the expected results. This feedback loop makes you better at analysis over time, as you learn which insights actually translate to improved performance.
While the framework above covers the analytical process, the tools you use to implement it can make or break your efficiency. Two platforms work particularly well together for advertisers who want both accurate tracking and streamlined campaign management: Cometly for ad tracking and attribution, and AdStellar for campaign launches.
Using Cometly for Accurate Ad Tracking
Cometly solves one of the biggest challenges in ad performance analysis: getting accurate attribution data. When you're running campaigns across multiple platforms, standard platform pixels often disagree about which ads drove which conversions. Cometly's tracking system provides a unified view of your customer journey across all touchpoints.
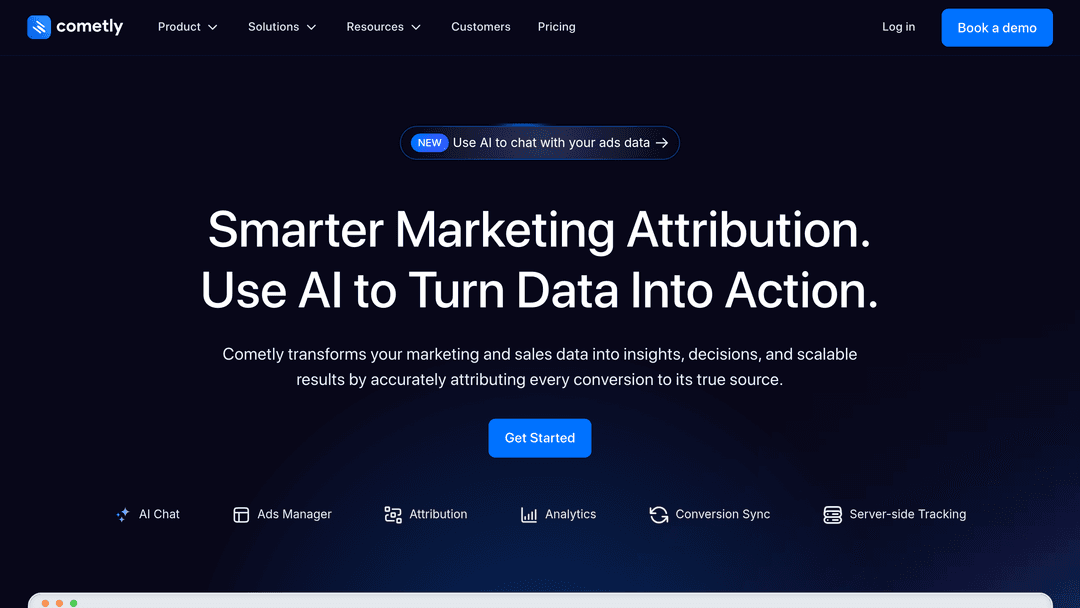
The platform's Ads Manager dashboard consolidates performance data from your connected ad accounts into a single interface. Instead of logging into Meta Ads Manager, then Google Ads, then LinkedIn Campaign Manager to piece together your performance story, you can see everything in one place with consistent metrics and attribution models.
What makes Cometly particularly valuable for the analysis framework outlined above is its focus on accurate conversion tracking. The platform uses first-party tracking that isn't affected by iOS privacy changes or cookie restrictions that have made platform-native tracking less reliable. This means the data you're analyzing in Steps 4-6 of the framework actually reflects reality, not an incomplete picture skewed by tracking limitations.
When you're segmenting data by campaign, audience, and creative in Step 3, Cometly's attribution modeling helps you understand which touchpoints genuinely contributed to conversions. This is especially valuable for longer sales cycles where customers interact with multiple ads before converting.
Using AdStellar AI to Launch Campaigns Based on Your Analysis
Once you've completed your analysis and created your action plan in Step 7, you need to actually implement those optimizations. This is where AdStellar AI comes in. The platform is designed to streamline the campaign creation process, which is particularly useful when your analysis reveals you need to launch multiple campaign variations to test new hypotheses.
For example, imagine your analysis revealed that video ads targeting a specific age demographic consistently outperform other creative formats. You want to test this winning pattern across five different audience segments and three messaging angles. That's 15 campaign variations you need to launch.
Manually creating 15 campaigns with slightly different targeting and creative would take hours. AdStellar's bulk launch capabilities let you set up the campaign structure once, define your variations, and deploy everything systematically. This speed matters because every day you delay implementing insights from your analysis is a day of suboptimal performance.
How These Tools Work Together in Your Analysis Workflow
The combination creates a complete workflow: Cometly provides the accurate tracking data you need for analysis, and AdStellar enables rapid implementation of optimization decisions. When you identify a winning pattern in Cometly's Ads Manager, you can quickly scale it by launching variations through AdStellar.
This integration between analysis and execution is what transforms ad performance management from a slow, manual process into a systematic optimization engine. You're not just analyzing faster—you're creating a feedback loop where insights quickly become tests, tests become validated winners, and winners get scaled efficiently.
For the framework outlined in this guide, consider this workflow: Use Cometly as your central dashboard from Step 1, rely on its accurate attribution data for Steps 2-6, then use AdStellar to execute the action plan you create in Step 7. This combination ensures you're making decisions based on reliable data and implementing those decisions without unnecessary delays.
Conclusion
Ad performance analysis doesn't have to be overwhelming. With this seven-step framework, you can transform hours of confused dashboard-staring into 15 minutes of focused, actionable analysis.
Start by centralizing your data so you're working from a single source of truth. Define clear success metrics tied to business goals, not vanity numbers. Segment your data to find what's really working. Analyze trends to catch problems early and spot opportunities. Identify your best and worst performers so you know where to focus. Diagnose why campaigns succeed or fail so you can replicate wins. And finally, create a clear action plan that turns insights into results.
The difference between advertisers who consistently improve their performance and those who spin their wheels isn't access to better data. It's having a systematic approach that turns data into decisions.
You don't need to be a data scientist. You don't need expensive analytics tools. You just need a framework that tells you what to look at, what it means, and what to do about it.
Now you have that framework. The next time you open your ad dashboard at 11 PM, you'll know exactly what you're looking for and exactly what action to take. No more guessing. No more paralysis. Just clear, confident decisions that improve your results week after week.