You're staring at your Meta Ads dashboard at 11 PM on a Tuesday, and the numbers aren't adding up. You launched 50 ad variations two weeks ago with a $200 daily budget—$2,800 spent so far. Three of those ads are printing money. The other 47? Pure waste. Every dollar that went to those underperformers could have been feeding your winners instead.
Sound familiar?
This is the reality for most media buyers, growth teams, and marketing agencies running paid campaigns in 2025. You're juggling Meta, Google, maybe TikTok—each platform demanding attention, each campaign multiplying your variables. Audiences times creatives times placements times timing equals hundreds of possible combinations. And somewhere in that chaos, 40-60% of your ad budget is quietly leaking away to variations that will never perform.
The traditional approach makes this worse, not better. Launch campaigns, wait for data, analyze spreadsheets, debate with your team, finally make adjustments. By the time you've identified your winners and killed your losers, you've burned through weeks and thousands of dollars. Meanwhile, your competitors—the ones who've figured out how to move faster—are already three optimization cycles ahead of you, capturing market share while you're still updating your pivot tables.
Here's what most articles about ad efficiency get wrong: they focus on surface-level tactics like "lower your CPA" or "improve your ROAS" without addressing the deeper system that actually drives results. They treat efficiency as a cost problem when it's really a speed problem. The advertiser who learns faster wins, even if their individual test results start out slightly less efficient.
This guide reveals the systematic approach that elite performance marketers use to transform ad spend from a guessing game into a predictable growth engine. You'll discover the four hidden waste patterns draining your budget right now, the three-dimensional efficiency framework that compounds your results, and the exact action plan for eliminating waste while scaling winners faster than your competition can react.
By the end, you'll know exactly how to identify which ads are stealing from your winners, how to automate the decisions that currently eat up your time, and how to build a testing system that gets smarter with every dollar you spend. No more hoping your campaigns work out. No more watching budget disappear into underperformers. Just a clear framework for turning every advertising dollar into measurable, scalable results.
Let's start by redefining what efficiency actually means—because the metrics you're probably tracking right now are only telling you one-third of the story.
The $10,000 Question Every Media Buyer Faces
You're staring at your Meta Ads dashboard at 11 PM on a Tuesday, and the numbers aren't adding up. You launched 50 ad variations two weeks ago with a $200 daily budget—$2,800 spent so far. Three of those ads are printing money. The other 47? Pure waste. Every dollar that went to those underperformers could have been feeding your winners instead.
Sound familiar?
This is the reality for most media buyers, growth teams, and marketing agencies running paid campaigns in 2025. You're juggling Meta, Google, maybe TikTok—each platform demanding attention, each campaign multiplying your variables. Audiences times creatives times placements times timing equals hundreds of possible combinations. And somewhere in that chaos, 40-60% of your ad budget is quietly leaking away to variations that will never perform.
The traditional approach makes this worse, not better. Launch campaigns, wait for data, analyze spreadsheets, debate with your team, finally make adjustments. By the time you've identified your winners and killed your losers, you've burned through weeks and thousands of dollars. Meanwhile, your competitors—the ones who've figured out how to move faster—are already three optimization cycles ahead of you, capturing market share while you're still updating your pivot tables.
Here's what most articles about ad efficiency get wrong: they focus on surface-level tactics like "lower your CPA" or "improve your ROAS" without addressing the deeper system that actually drives results. They treat efficiency as a cost problem when it's really a speed problem. The advertiser who learns faster wins, even if their individual test results start out slightly less efficient.
This guide reveals the systematic approach that elite performance marketers use to transform ad spend from a guessing game into a predictable growth engine. You'll discover the four hidden waste patterns draining your budget right now, the three-dimensional efficiency framework that compounds your results, and the exact action plan for eliminating waste while scaling winners faster than your competition can react.
By the end, you'll know exactly how to identify which ads are stealing from your winners, how to automate the decisions that currently eat up your time, and how to build a testing system that gets smarter with every dollar you spend. No more hoping your campaigns work out. No more watching budget disappear into underperformers. Just a clear framework for turning every advertising dollar into measurable, scalable results.
Let's start by redefining what efficiency actually means—because the metrics you're probably tracking right now are only telling you one-third of the story.
Decoding Ad Spend Efficiency: Beyond The Surface Metrics
Here's the thing about ad spend efficiency that most dashboards won't tell you: when you're obsessing over your cost per acquisition or return on ad spend, you're only measuring one-third of what actually matters. Think of it like judging a car's performance by looking only at its gas mileage while ignoring how fast it goes and how easy it is to drive.
The most sophisticated media buyers in 2025 measure efficiency across three dimensions simultaneously: capital efficiency (the ROI metrics you already track), time efficiency (how quickly you move from test to scale), and cognitive efficiency (how much mental bandwidth your optimization process consumes). When you optimize only one dimension, you create bottlenecks in the others that silently kill your overall performance.
The Three-Dimensional Efficiency Framework
Let's break down what true efficiency actually looks like when you zoom out from your CPA numbers.
Capital Efficiency: This is the obvious dimension—your ROI, ROAS, and cost per acquisition. It measures how much revenue you generate for every dollar spent. Most advertisers stop here, thinking they've got efficiency figured out if these numbers look good.
Time Efficiency: This is the overlooked dimension that separates good media buyers from exceptional ones. It measures the speed from test launch to scale decision. How many days pass between identifying a winning variation and actually increasing its budget? Every day of delay is a day your competitor captures market share while you're still analyzing spreadsheets.
Cognitive Efficiency: This is the hidden dimension that determines your maximum scale potential. It measures the mental bandwidth saved through systematic processes and automation. When you're manually checking dashboards, exporting data, and making decisions for dozens of campaigns, your brain becomes the bottleneck.
Here's where this gets interesting. Consider two campaigns running simultaneously:
Campaign A achieves a $5 cost per acquisition, takes 14 days to identify and scale winners, and requires daily manual analysis across multiple spreadsheets. Campaign B achieves a $6 CPA, identifies winners in just 2 days, and uses automated decision-making that requires minimal oversight.
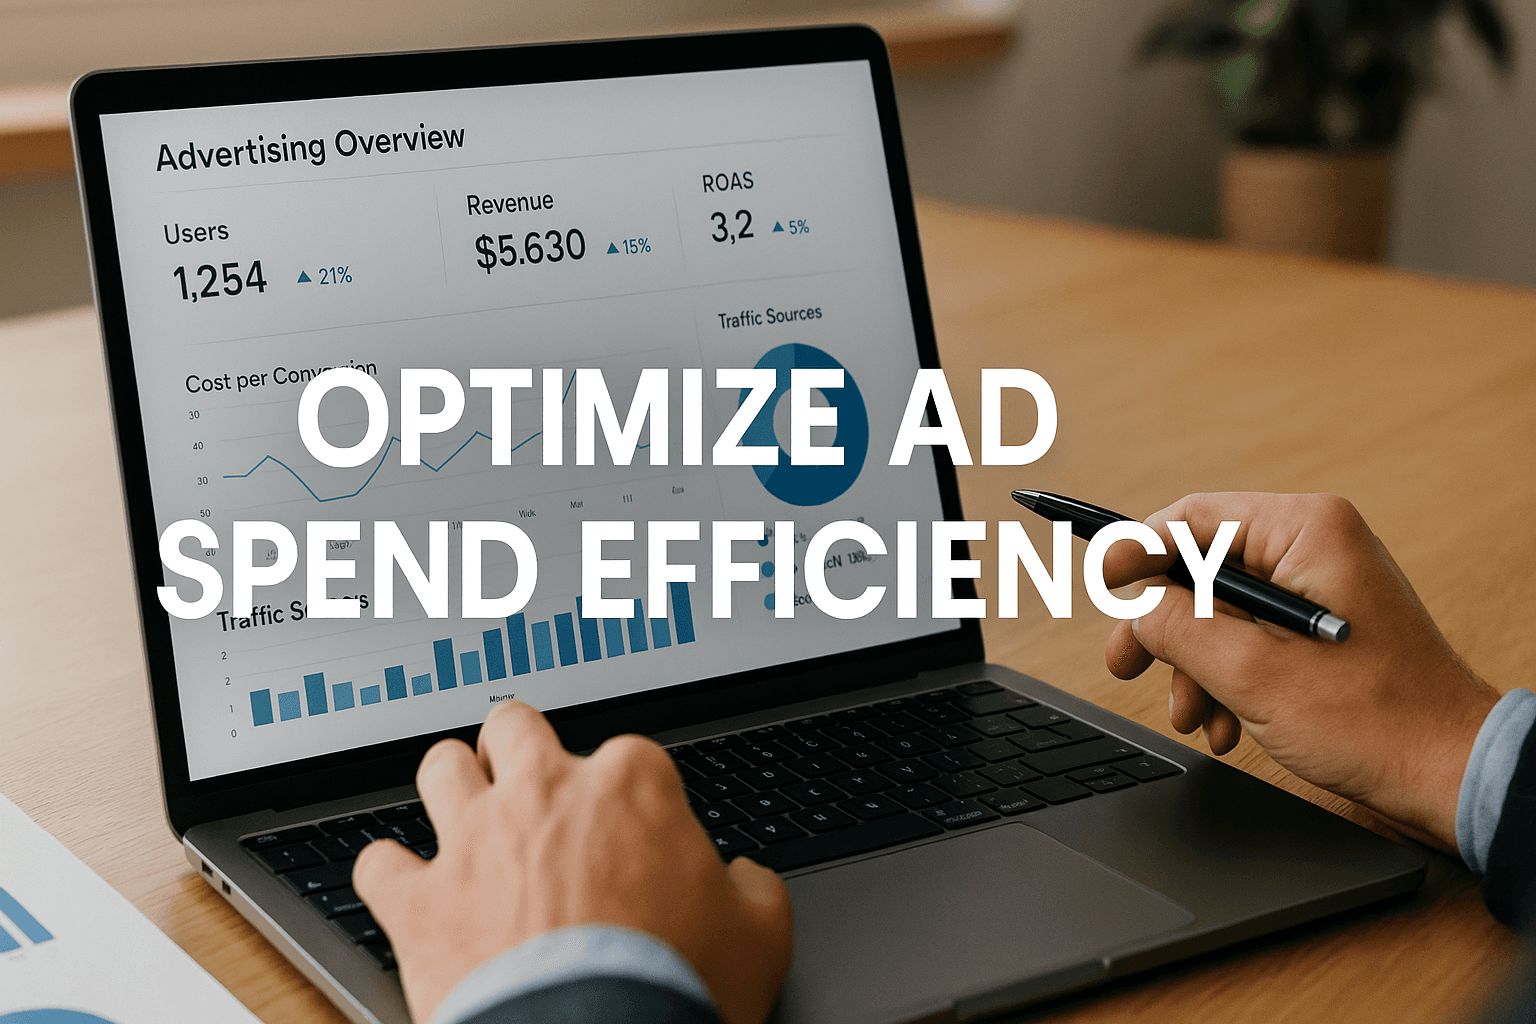
Modern ad campaign management demands more than spreadsheets and manual data exports. The dashboard interface you use fundamentally shapes how quickly you can identify patterns, make decisions, and respond to performance shifts. Elite media buyers in 2025 prioritize dashboard software that strips away complexity in favor of clear, actionable visualization—think clean data hierarchies, instant filtering, and real-time performance updates without the cognitive overhead of cluttered legacy interfaces.
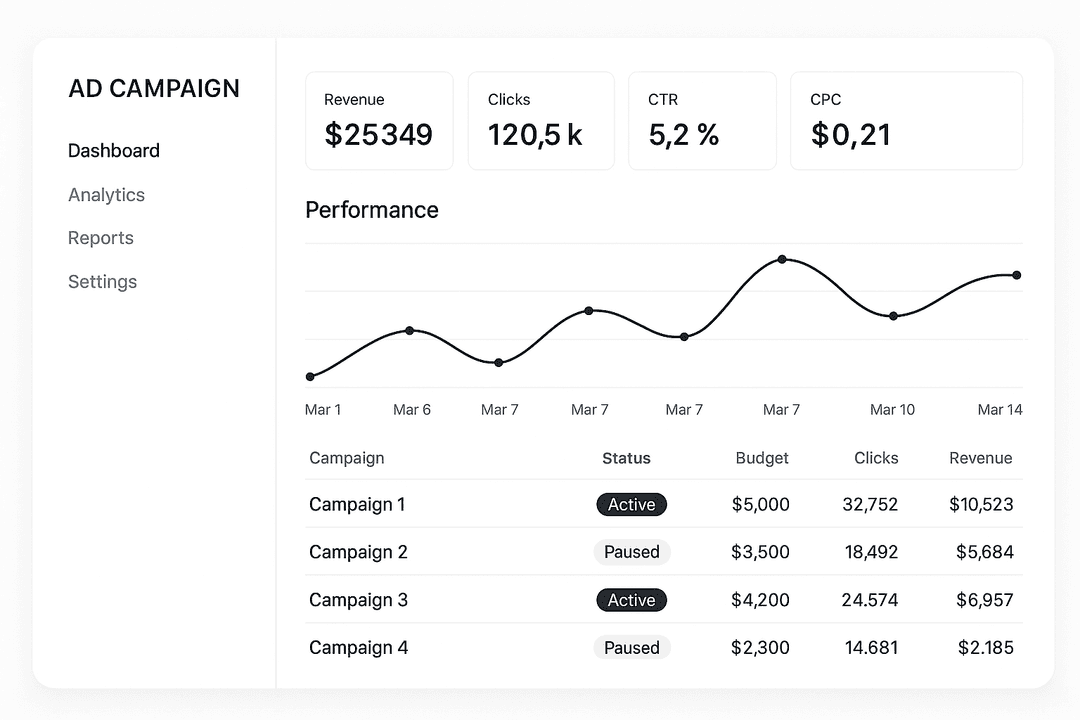
The best campaign dashboards share a common design philosophy: information density without visual noise. They present your most critical metrics—spend, conversions, CPA, ROAS—in instantly scannable layouts that let you assess campaign health in seconds rather than minutes. Performance trends appear as clean line graphs with intuitive color coding. Campaign comparisons sit side-by-side for immediate pattern recognition. No hunting through nested menus or decoding cryptic abbreviations.
Consider what "clean and modern" actually means in practical terms for your daily workflow. When you open your dashboard at 9 AM, you should immediately see which campaigns exceeded their CPA targets overnight, which creatives are showing fatigue patterns, and which audience segments are trending upward—all without clicking through multiple screens or building custom views. The interface should feel minimal not because it hides information, but because it reveals only what matters for the decision you're making right now.
Key interface elements that define efficiency-focused dashboard design:
Real-time performance cards: Each campaign or ad set gets a card-style visualization showing current spend, conversion count, and efficiency metrics against your targets. Color-coded indicators (green for outperforming, yellow for monitoring, red for underperforming) let you triage attention instantly. No manual calculations needed to know what requires action.
Comparative trend visualization: Clean line graphs that overlay multiple campaigns on the same timeline, making performance divergence immediately visible. You spot the exact moment one variation started outperforming another—no need to export data and build comparison charts manually.
Hierarchical navigation: Drill from account-level overview to campaign groups to individual ad variations with single clicks. Each level maintains the same visual language and metric structure, eliminating the mental reset that comes from inconsistent interface design across navigation levels.
Contextual action buttons: Budget adjustment, pause, duplicate, and scaling controls appear directly on campaign cards—right where you're already looking at performance data. This reduces the friction between insight and action from multiple clicks down to one.
The shift toward minimal, tech-forward dashboard design isn't just aesthetic preference—it's a direct response to the cognitive load problem that manual optimization creates. When you're managing dozens or hundreds of campaigns across multiple platforms, every second spent parsing visual complexity is time not spent on strategic decisions. Clean interfaces with intentional white space, consistent typography, and logical information grouping reduce decision fatigue and accelerate your insight-to-action cycle.
Many performance marketers find that modern dashboard interfaces incorporating these design principles help them process campaign data significantly faster than traditional platform-native dashboards. The reduction in visual clutter and improvement in information architecture means less time hunting for metrics and more time acting on them.
This is why the most sophisticated media buyers often supplement platform-native dashboards with third-party analytics tools that prioritize clean, unified visualization across channels. When your Meta campaigns, Google ads, and TikTok tests all appear in the same visual language with consistent metric definitions, you eliminate the translation layer that slows down cross-platform optimization decisions.
Traditional thinking says Campaign A is more efficient because of that lower CPA. But here's the reality: Campaign B completes seven optimization cycles in the same timeframe that Campaign A completes one. Those compounding learning cycles mean Campaign B will ultimately achieve better overall performance, even though it started with a slightly higher cost per acquisition.
Why Traditional Metrics Create Dangerous Blind Spots
Standard efficiency metrics like CPA and ROAS measure past performance, not future potential. They tell you what happened, but they don't account for opportunity cost—the revenue you're losing while you're still stuck in analysis mode instead of scaling your winners.
Picture two advertisers launching campaigns on the same day. Advertiser A achieves a $4 CPA but takes 21 days to identify their winner and scale it. Advertiser B achieves a $5 CPA but identifies their winner in just 3 days and scales immediately.
Fast forward 60 days. Advertiser A has completed two optimization cycles and is still analyzing their third test, stuck in that familiar pattern of "let's give it a few more days to be sure."
The Three-Dimensional Efficiency Framework
Here's what separates elite media buyers from everyone else: they don't just track cost per acquisition. They measure efficiency across three interconnected dimensions that most advertisers completely ignore. And when you optimize all three simultaneously, the results compound in ways that single-metric optimization never achieves.
Capital Efficiency: This is the obvious one—the metrics everyone watches. Return on ad spend, cost per acquisition, cost per click. These numbers tell you whether your money is working hard enough. A $5 CPA beats a $7 CPA, right? Not always. Because capital efficiency only measures past performance, not the speed at which you're learning or the mental bandwidth you're preserving for strategic decisions.
Time Efficiency: This is the dimension most advertisers overlook entirely. How fast can you move from test launch to scale decision? The traditional approach takes 7-14 days: launch campaigns, accumulate data, export to spreadsheets, analyze patterns, debate with your team, finally implement changes. Meanwhile, market conditions shift. Competitors capture opportunities. Your winning ad starts fatiguing before you've even scaled it.
Think about it this way: if you can identify winners in 2 days instead of 14, you complete 7x more optimization cycles in the same timeframe. Each cycle teaches you something new. Each learning compounds on the previous one. Speed isn't just about moving fast—it's about learning faster than your competition can react.
Cognitive Efficiency: This is the hidden dimension that determines your maximum scale potential. Every manual decision consumes mental bandwidth. Every spreadsheet you build, every dashboard you check, every budget adjustment you calculate—that's cognitive load that could be spent on strategy instead of execution. When you're drowning in operational tasks, you can't think strategically about market positioning, creative angles, or competitive moves.
Here's where this gets interesting. Let's compare two campaigns side by side:
Campaign A achieves a $5 CPA. Sounds great. But it takes 14 days to identify the winning variation and scale it. During those 14 days, you're manually checking dashboards, exporting data, running analyses. You're spending 2-3 hours daily on optimization decisions. Your brain is in execution mode, not strategy mode.
Campaign B achieves a $6 CPA—slightly higher. But automated rules identify the winner in 2 days and scale it immediately. You spend 20 minutes reviewing the automated decisions. Your mental bandwidth is freed up to think about the next test, the next creative angle, the next market opportunity.
Traditional thinking says Campaign A is more efficient because of that lower CPA. But here's the reality: Campaign B completes 7x more optimization cycles in the same period. Each cycle generates new insights. Each insight improves the next test. After 90 days, Campaign B has run through 45 optimization cycles while Campaign A is still on cycle 6. The compounding effect of faster learning means Campaign B is now achieving $3.50 CPA while Campaign A is stuck at $5.
This is why focusing solely on cost metrics creates a false sense of efficiency. You're optimizing one dimension while ignoring the two that actually determine your competitive advantage. The advertiser who learns faster and preserves mental bandwidth for strategic thinking will always outperform the one who manually optimizes for slightly better CPAs.
Why Traditional Metrics Create Blind Spots
Here's the uncomfortable truth: your CPA and ROAS numbers are lying to you. Not because they're inaccurate, but because they're incomplete. They tell you what happened yesterday while completely ignoring what's happening right now—the opportunities slipping away while you're still crunching numbers in spreadsheets.
Standard efficiency metrics measure past performance, not future potential. That $5 CPA you're celebrating? It's a historical artifact. By the time you've gathered enough data to feel confident about it, analyzed it across multiple dimensions, and finally decided to scale, the market has already moved. Your competitors have captured the audience segments you were "still evaluating." The creative angles you were "waiting to validate" have already been tested and scaled by faster-moving advertisers.
This is the opportunity cost that traditional metrics completely miss—the revenue you didn't capture because your decision-making process couldn't keep pace with market velocity.
Let's make this concrete with two advertisers launching campaigns on the same day:
Advertiser A: Achieves a $4 CPA after careful testing. Takes 21 days to gather sufficient data, analyze performance across segments, debate budget allocation with the team, and finally scale the winning variation. Methodical, data-driven, responsible.
Advertiser B: Achieves a $5 CPA with faster testing protocols. Identifies the winner in 3 days using automated performance triggers and scales immediately. Slightly higher initial cost, but moves at market speed.
Traditional efficiency thinking declares Advertiser A the winner. Lower CPA equals better performance, right?
But here's what happens over 60 days:
Advertiser A completes 2 full optimization cycles—launch, test, analyze, scale, repeat. They're currently analyzing their third test, still gathering data, still being "responsible" with budget decisions. Their campaigns are efficient in isolation but slow in aggregate.
Advertiser B completes 20 optimization cycles in the same timeframe. Each cycle compounds learnings from the previous one. They've tested 10x more audience segments, creative variations, and messaging angles. They've killed losers faster and scaled winners harder. By day 60, their accumulated insights have driven their CPA down to $3.50—better than Advertiser A ever achieved—while capturing significantly more market share along the way.
The advertiser who learns faster ultimately wins, even if individual test results start out slightly less efficient. Speed compounds. Delay costs.
This reveals three critical misconceptions that traditional metrics perpetuate:
Misconception #1: "Lower CPA always means better efficiency." This ignores time and scale factors entirely. A $4 CPA that takes 3 weeks to identify and scale captures less total value than a $5 CPA that scales in 3 days and iterates continuously. The second advertiser runs more experiments, gathers more insights, and ultimately achieves better performance through velocity.
Misconception #2: "Manual optimization gives more control." It actually creates bottlenecks that limit your maximum scale potential. Every hour spent in spreadsheets is an hour not spent testing new variations. Every day spent debating budget allocation is a day your competitors are capturing market share. Manual
The Four Hidden Waste Patterns Draining Your Ad Budget
Most advertisers can spot the obvious failures—ads with zero conversions, campaigns that never gained traction. But here's what separates average media buyers from elite performers: the ability to identify subtle waste patterns. These are the underperformers that look "okay" at first glance but quietly drain thousands from your budget while starving your actual winners of the fuel they need to scale.
Let's hunt down the four patterns that are probably costing you right now.
Pattern #1: The "Hope and Pray" Testing Trap
You launch 20 ad variations at $10 per day each. Total daily spend: $200. Seems reasonable, right? You're testing multiple angles, spreading risk, keeping individual variation costs low.
Here's the problem: no single variation gets enough budget to reach statistical significance. After seven days and $1,400 spent, each variation has maybe 56 clicks and 2-3 conversions. You're staring at a dashboard full of "maybes"—everything looks mediocre because nothing got enough volume to prove itself.
The psychological trap kicks in: "Let's run it a few more days." So you do. And a few more after that. Meanwhile, your budget continues fragmenting across variations that will never generate reliable insights.
The reality: Fewer variations with concentrated budget produce faster, more reliable insights than spreading thin across many tests. Five variations at $40 per day will teach you more in three days than 20 variations at $10 per day will teach you in two weeks.
Pattern #2: The Manual Optimization Lag
Day 1-3: Your test runs, data accumulates in the dashboard. Day 4: You notice one variation performing well. Day 5-6: You export the data, build your analysis spreadsheet, discuss with your team, debate budget reallocation strategies. Day 7: You finally increase budget on the winner.
Congratulations—you just gave your competitors a five-day head start.
This manual workflow creates a 3-7 day gap between identifying winners and actually scaling them. By the time you've updated your campaigns, market conditions may have shifted. Your competitor using automated rules? They identified the same pattern on Day 2, scaled on Day 3, and captured five additional days of optimal performance while you were updating spreadsheets.
The reality: Speed from insight to action determines overall efficiency more than the quality of insights themselves. A slightly less optimal decision made today beats a perfect decision made next week.
Pattern #3: The "Set and Forget" Performance Decay
Month 1: Your new ad variation crushes it at $4 CPA. You celebrate, scale to $500 per day, and move on to the next challenge. Month 2: That same ad is now delivering $5.20 CPA—a 30% decay you haven't noticed because you're focused on newer campaigns. Month 3: It's at $6.50 CPA, still running at $500 daily spend.
Over 90 days, you've burned thousands in excess costs that could have funded new winning variations. This is ad fatigue in action—your winning creative loses effectiveness as audiences see it repeatedly
Putting It All Together
Ad spend efficiency isn't about spending less—it's about learning faster. The advertisers who win in 2025 are the ones who can identify losing variations in days instead of weeks, scale winners before market conditions shift, and compound their insights across every campaign they run.
The four-step framework we've covered gives you the systematic approach to make this happen: establish your baseline, implement automated decision triggers, build continuous testing loops, and create knowledge systems that get smarter with every dollar spent. Each step eliminates a specific waste pattern while accelerating your path from test to scale.
But here's the reality: implementing this framework manually still leaves you fighting against time. You can have the perfect testing methodology, the right success metrics, and a clear scaling strategy—and still lose to competitors who've automated the execution. The gap between knowing what to do and doing it fast enough to capture market opportunities is where most efficiency gains actually hide.
This is where AI-powered automation transforms the game entirely. Instead of spending hours analyzing dashboards and updating spreadsheets, you need a system that monitors performance in real-time, applies your decision rules automatically, and launches new variations based on winning patterns—all while you focus on strategy instead of execution.
If you're ready to stop watching budget leak to underperformers and start scaling winners at the speed your competition can't match, Get Started With AdStellar AI. Our platform analyzes your top-performing creatives, headlines, and audiences—then builds, tests, and launches new ad variations automatically, turning the four-step framework into a system that runs 24/7 without the manual bottlenecks.