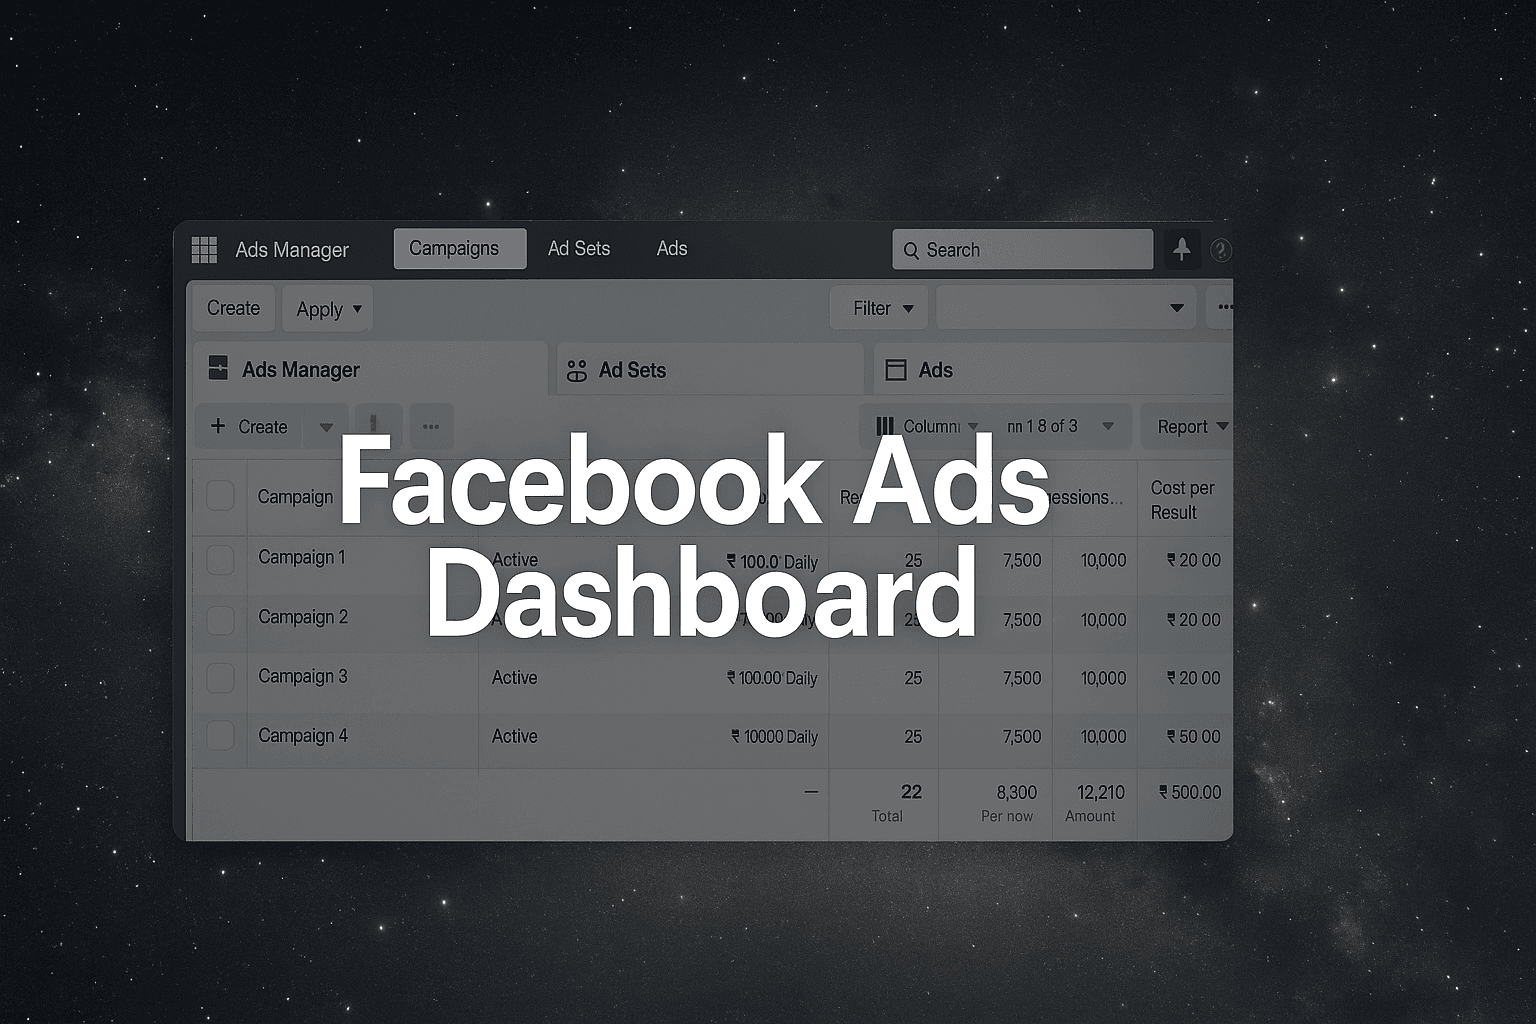
Staring at the Facebook Ads Dashboard for the first time feels like sitting in the cockpit of a commercial airplane without pilot training. Dozens of metrics flash before your eyes, campaign statuses blink in different colors, and you're not sure which button might accidentally drain your entire ad budget. That sinking feeling in your stomach? It's completely normal—and you're not alone in experiencing it.
The dashboard intimidation is real, and it's by design. Facebook built this interface for power users managing millions in ad spend across hundreds of campaigns. The complexity serves experienced marketers brilliantly, but it creates a legitimate barrier for everyone else. You're looking at conversion rates, frequency caps, relevance scores, and cost-per-result metrics, wondering which numbers actually matter and which ones you can safely ignore.
Here's what makes this particularly stressful: one wrong click could theoretically launch a campaign with the wrong budget, target the wrong audience, or duplicate ads you meant to pause. The fear of financial mistakes often paralyzes new users more than the fear of poor performance. You know this tool holds the key to reaching your ideal customers and growing your business, but the gap between "I need to use this" and "I understand this" feels impossibly wide.
The good news? Dashboard mastery is a learnable skill, not an innate talent. Every expert you see confidently navigating between campaign levels and analyzing performance data started exactly where you are now—overwhelmed and uncertain. The difference is they developed a systematic approach to understanding the interface, and that's exactly what this guide will give you.
By the end of this walkthrough, you'll transform from someone who nervously clicks around the dashboard to someone who confidently monitors campaigns, identifies optimization opportunities, and makes data-driven decisions without second-guessing every action. We'll build your skills systematically, starting with proper setup and progressing through navigation, monitoring, analysis, and eventually automation strategies that let you scale efficiently.
Modern solutions like AI-powered platforms can automate many of the complex dashboard tasks you're about to learn, but understanding the fundamentals first ensures you know what's happening behind the automation. You'll make better strategic decisions when you understand how the dashboard actually works, even if AI eventually handles the tactical execution.
Let's transform this intimidating control center into your most powerful marketing tool, step by step.
Step 1: Master Your Dashboard Foundation Setup
Before you can navigate the Facebook Ads Dashboard with confidence, you need proper access and permissions. This isn't just about logging in—it's about establishing the right account structure that prevents frustrating roadblocks later. Many marketers skip these foundation steps and end up locked out of critical features or unable to access client accounts when they need them most.
The foundation starts with understanding that Facebook advertising requires a Business Manager account, not just your personal Facebook profile. This distinction confuses many beginners who assume their regular Facebook login grants full advertising access. It doesn't. Business Manager serves as the control center for all your advertising activities, separating your personal social media presence from your professional marketing operations.
Business Manager Account Requirements
Setting up Business Manager correctly takes about 15 minutes but saves countless hours of access issues down the road. Navigate to business.facebook.com and create your Business Manager account using your work email address—not your personal email tied to your Facebook profile. This separation maintains professional boundaries and ensures account continuity if team members change.
During setup, Facebook will ask you to verify your business through documentation like business licenses or utility bills. The verification process typically takes 1-3 business days, though it can extend longer if your documentation doesn't match Facebook's requirements exactly. Common roadblocks include mismatched business names between your registration and official documents, or using residential addresses for businesses that should have commercial locations.
Have your business registration documents ready before starting to avoid delays. Once verified, you'll need to add your ad account to Business Manager. Navigate to Business Settings, select "Accounts," then "Ad Accounts," and either create a new ad account or request access to an existing one. This is where many marketers encounter their first major confusion: the difference between owning an ad account and having access to one.
Dashboard Access and Permission Levels
Facebook's permission system operates on a hierarchy that determines what you can see and do in the dashboard. Understanding these levels prevents the frustration of attempting actions your permission level doesn't allow—like trying to edit campaigns when you only have Analyst access.
Admin Access: Full control over the ad account, including the ability to manage other users' permissions, view billing information, and make any campaign changes. You need Admin access to add payment methods or grant access to other team members. This level is essential for account owners and senior managers.
Advertiser Access: The sweet spot for most day-to-day campaign management. Advertisers can create, edit, and delete campaigns, ad sets, and ads. They can view performance data and make optimization decisions, but they cannot manage billing or user permissions. This level provides dashboard mastery capabilities without administrative overhead.
Analyst Access: View-only permissions that allow dashboard monitoring and reporting without the ability to make changes. This level works well for junior team members learning the platform or clients who want visibility into campaign performance without editing capabilities.
To request access to a client's ad account, you'll need their Business Manager ID or ad account ID. They can find this in their Business Settings under Ad Accounts. Once they grant you access at the appropriate permission level, the account will appear in your Business Manager dashboard within minutes. For businesses managing multiple accounts or looking to streamline this process, exploring ai agent for facebook ads solutions can automate permission management and account switching workflows.
Step 2: Navigate the Dashboard Interface Like a Pro
You've got access. Now comes the moment that separates confident dashboard users from those who click nervously and hope for the best. The Facebook Ads Dashboard interface follows a logical structure, but that logic isn't immediately obvious when you're staring at dozens of tabs, columns, and buttons for the first time.
Here's the truth: professional advertisers don't remember where everything is through sheer memorization. They understand the underlying architecture—the mental map that makes navigation intuitive rather than overwhelming. Once you grasp this structure, you'll stop hunting for features and start moving through the dashboard with purpose.
Understanding the Main Navigation Architecture
The dashboard operates on a three-tier hierarchy that mirrors how Facebook thinks about advertising: Campaigns contain Ad Sets, which contain Ads. This isn't just organizational philosophy—it's the actual navigation structure you'll use every single day.
When you open Ads Manager, you land on the Campaigns tab by default. This top-level view shows your highest-level strategy: campaign objectives, overall budgets, and total performance. Click into any campaign name, and you drop down one level to Ad Sets—where you define audiences, placements, and scheduling. Click an Ad Set name, and you reach the Ad level, where individual creatives live.
The left sidebar is your command center. At the top, you'll find the account switcher (critical if you manage multiple businesses). Below that, the main navigation sections appear in order of workflow: Campaigns, Ad Sets, Ads, then supporting tools like Audiences, Pixels, and Reporting. Facebook organized this sidebar to match the typical campaign creation sequence, which means following it top-to-bottom naturally guides you through proper setup.
The top toolbar contains your action buttons: Create, Edit, Duplicate, and the critical Filters dropdown. These tools work contextually—meaning they change based on which level you're viewing. When you're on the Campaigns tab, "Create" launches campaign setup. Drop down to Ads, and "Create" opens the ad builder instead.
Keyboard Shortcuts and Efficiency Hacks
Professional dashboard users rarely touch their mouse for common actions. Learning just five keyboard shortcuts will cut your navigation time in half and make you look like you've been doing this for years.
The Essential Five Shortcuts: Press "C" to create a new campaign, ad set, or ad (depending on which tab you're viewing). Use "E" to edit selected items instantly. Hit "D" to duplicate campaigns without clicking through menus. Press "/" to jump directly to the search bar, then type campaign names or IDs to find anything instantly. And "Shift + ?" opens the complete shortcuts menu when you need a reminder.
Beyond keyboard shortcuts, browser organization dramatically impacts efficiency. Create a dedicated bookmark folder for Facebook Ads with quick links to your most-used dashboard views. Save filtered views for active campaigns, paused campaigns requiring review, and high-spending campaigns that need daily monitoring. These saved views eliminate repetitive filtering and let you jump directly to the data you need.
As you master Facebook's navigation logic, you'll notice it follows platform-specific patterns that differ from other advertising systems. Understanding these differences becomes especially important if you're managing multi-platform campaigns—our comparison of facebook ads vs google ads highlights how dashboard navigation and campaign structure vary across platforms. This Facebook-specific hierarchy means that skills you develop here require adaptation when working with other advertising platforms, but the analytical thinking transfers universally.
Step 3: Build Your Campaign Monitoring System
You've mastered navigation, but now comes the real challenge: transforming the dashboard from a data display into an intelligence system that actually tells you what's working and what needs attention. Most marketers treat the dashboard like a rearview mirror—checking it occasionally to see what already happened. Professional campaign managers treat it like a flight instrument panel—constantly monitoring key indicators that predict performance before problems emerge.
The default dashboard view shows you basic metrics like spend, reach, and results. That's fine for casual monitoring, but it hides the performance indicators that separate profitable campaigns from money pits. You need to customize your view to surface the metrics that matter for your specific campaign objectives, create naming systems that prevent chaos as your account grows, and build filter strategies that let you isolate exactly the data you need in seconds.
Custom Column Configuration for Maximum Insight
The columns you see in your dashboard determine which questions you can answer at a glance. Facebook's default view prioritizes basic metrics—delivery status, budget, amount spent, reach, and results. These tell you what happened but rarely explain why it happened or what to do about it.
Start by adding cost-per-result as a permanent column—this single metric instantly reveals whether your campaigns are becoming more or less efficient over time. If your cost-per-result is rising while spend increases, you're experiencing diminishing returns that require immediate attention. Proper metric tracking forms the foundation of effective ad spend optimization, enabling data-driven decisions that improve campaign ROI.
Next, add frequency to your column set. This metric shows how many times the average person has seen your ad. Frequency above 3.0 often indicates audience fatigue—your creative is wearing out and performance will decline unless you refresh it. Many marketers miss this warning sign because frequency isn't visible in the default view, then wonder why their previously successful campaigns suddenly stopped working.
For conversion-focused campaigns, add columns for link clicks, landing page views, and conversion rate. These three metrics together tell the complete story of your funnel performance. High link clicks but low landing page views? Your ad loads too slowly or the destination URL is broken. High landing page views but low conversions? Your offer or landing page needs work, not your targeting.
Create multiple column sets for different analysis needs. Save one configuration for daily monitoring (cost, results, cost-per-result, frequency), another for creative testing (relevance score, engagement rate, click-through rate), and a third for funnel analysis (landing page views, add-to-cart, purchases). Facebook lets you save these custom views and switch between them instantly—use this feature to avoid constantly adding and removing columns.
Campaign Naming and Organization Systems
A disorganized campaign list becomes unmanageable fast. When you're running five campaigns, random names work fine. When you're running fifty campaigns across multiple objectives, audiences, and creative variations, you need systematic naming conventions that let you understand what each campaign does at a glance.
Professional naming follows a consistent formula: [Objective][Audience][Creative][Date]. For example: "ConversionsRetargetingVideoAdJan2026" immediately tells you this campaign targets conversions using retargeting audiences with video creative launched in January 2026. This naming structure lets you sort campaigns alphabetically and instantly see all conversion campaigns grouped together, all retargeting campaigns adjacent, and all video creative variations clustered.
Apply the same systematic approach to ad sets and individual ads. Ad set names should include audience details and placement information: "Retargeting30DaysFeed" tells you this targets people who visited in the last 30 days and shows only in Feed placements. Ad names should identify the creative variation: "VideoAdProblemFocusedV1" distinguishes this from "VideoAdSolutionFocusedV2" when you're testing messaging angles.
Use labels to add another organizational layer beyond naming. Facebook's label system lets you tag campaigns with custom categories like "High Priority," "Testing," or "Evergreen." Filter by labels to instantly view all campaigns in a specific category regardless of their naming structure. This becomes invaluable when you need to quickly audit all testing campaigns or review performance across all high-priority initiatives.
Step 4: Master Performance Analysis and Optimization
You've built your monitoring system, but raw data means nothing until you can translate it into action. This is where most marketers hit a wall—they see the numbers, but they don't know what story those numbers are telling. The dashboard shows you cost per result, click-through rates, and conversion metrics, but which ones actually matter for your specific campaigns?
Here's the truth: metrics don't exist in isolation. They're interconnected data points that reveal patterns, and those patterns tell you exactly what's working and what needs fixing. Professional media buyers don't just look at individual numbers—they read the relationships between metrics like a detective analyzing clues at a crime scene.
Reading Performance Indicators Like a Pro
Start with your primary objective metric—the one that directly measures your campaign goal. If you're running conversions, that's cost per conversion. For awareness campaigns, it's cost per thousand impressions (CPM). Everything else supports or explains this primary metric.
Now look at the supporting metrics that influence your primary number. High click-through rate but low conversions? Your ad creative is compelling, but your landing page or offer isn't converting. Low click-through rate but high conversion rate? You're reaching the right people, but your creative isn't capturing attention at scale.
Understanding metric relationships requires practice and multiple perspectives on data interpretation. For an alternative approach to dashboard analysis, our guide on the meta ads dashboard provides complementary techniques for reading campaign data like a detective. Whether you use Facebook's terminology or Meta's branding, the analytical principles remain consistent across the platform.
Watch for early warning signs that predict future problems. Frequency creeping above 3.0 means you're showing ads to the same people too often, which leads to ad fatigue and rising costs. Relevance score dropping below 6 signals that your audience isn't responding well to your creative or targeting. Catch these patterns early, and you can adjust before they tank your performance.
Establish benchmarks based on your own historical data, not industry averages. Your cost per conversion might be higher than published benchmarks, but if it's profitable for your business model, that's what matters. Track your own performance trends over time to identify what "good" looks like for your specific campaigns.
Identifying Winning Elements and Scaling Opportunities
The dashboard reveals which campaign elements drive success, but pattern recognition requires systematic comparison. Break down performance by audience segment first. Navigate to the breakdown view and analyze results by age, gender, placement, and device. You'll often discover that 80% of your results come from 20% of your audience segments.
Compare creative performance across campaigns to identify winning elements. If video ads consistently outperform static images in your account, that's a scalable insight. If carousel ads drive lower cost per conversion than single image ads, you've found a format advantage to exploit across campaigns.
Look for timing patterns in your hourly performance data. Some businesses see dramatically better results during specific hours or days of the week. If your conversion rate doubles on Tuesday afternoons compared to Sunday mornings, you can optimize budget allocation accordingly or adjust ad scheduling to capitalize on high-performance windows.
Placement analysis often reveals surprising opportunities. Many advertisers assume Instagram Stories underperform, but dashboard data might show Stories delivering your lowest cost per conversion. Test assumptions against actual performance data rather than relying on conventional wisdom about which placements work best.
When you identify winning elements, scale them systematically rather than dramatically increasing budgets overnight. Facebook's algorithm needs time to adjust to budget changes—doubling a campaign budget in one day often triggers a learning reset that temporarily tanks performance. Instead, increase budgets by 20-30% every few days, giving the algorithm time to maintain performance while scaling delivery.
Advanced Optimization Techniques
Once you've mastered basic performance analysis, advanced techniques separate good results from exceptional ones. The dashboard's breakdown tools let you analyze performance at granular levels most marketers never explore.
Use the delivery breakdown to understand when Facebook shows your ads. If your campaign targets a global audience but most conversions happen during US business hours, you're wasting budget on international impressions during off-peak times. Adjust your ad scheduling to concentrate spend during high-conversion windows.
The action breakdown reveals which conversion events drive results. If you're optimizing for purchases but most conversions are add-to-cart events, your funnel has a checkout problem that advertising optimization can't fix. This insight redirects your attention from campaign tweaks to landing page improvements that will actually move the needle.
Dynamic creative testing through the dashboard lets you test multiple creative elements simultaneously without creating dozens of ad variations manually. Upload multiple images, headlines, and descriptions, and Facebook automatically tests combinations to find the highest-performing mix. Monitor these tests through the asset reporting view to identify which specific elements drive performance.
For businesses managing complex campaign portfolios or looking to automate these optimization workflows, exploring ai for facebook ads solutions can handle the tactical execution while you focus on strategic decisions. The dashboard skills you've developed ensure you understand what's happening behind the automation and can intervene when necessary.
Ready to transform your advertising strategy? Start Free Trial With AdStellar AI and be among the first to launch and scale your ad campaigns 10× faster with our intelligent platform that automatically builds and tests winning ads based on real performance data.