You launch a fresh batch of ads on Monday. By Wednesday, one creative is getting clicks, another is holding attention but not converting, and a third has decent spend with ugly top-line efficiency. The team starts guessing. Maybe the hook is weak. Maybe the audience is off. Maybe Meta is just being Meta.
That's the moment when most accounts drift into opinion-led decision-making.
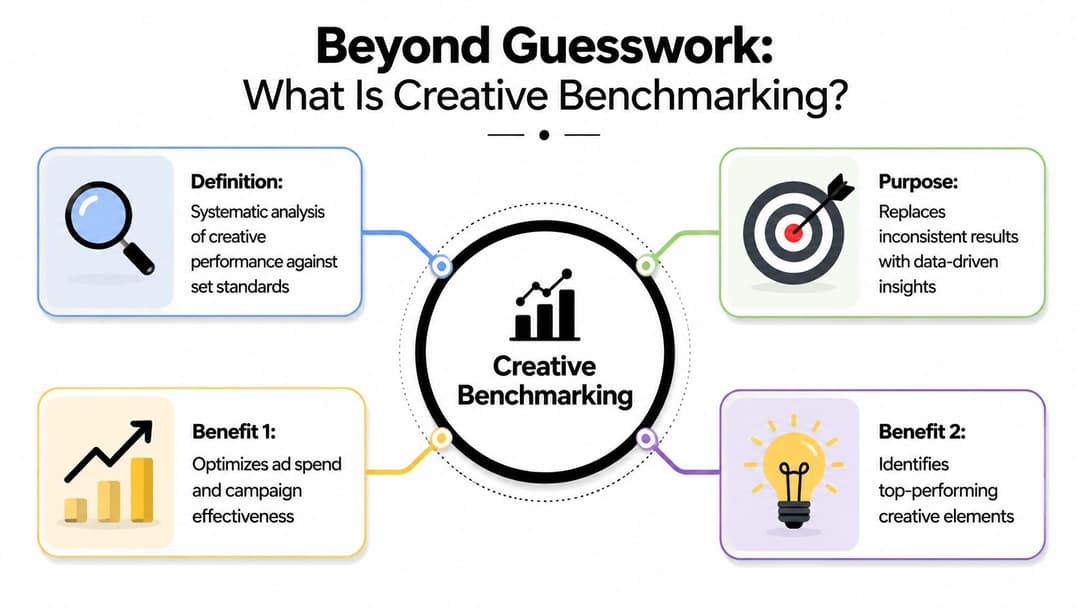
Creative benchmarking fixes that. It gives you a way to judge ads against meaningful reference points, diagnose where a creative breaks, and decide what to change next. Not just whether an ad is “good” or “bad,” but whether it fails in the first seconds, loses momentum in the body, or attracts attention without generating intent.
Beyond Guesswork What Is Creative Benchmarking
A lot of marketers think benchmarking means comparing this month's ads to last month's ads. That's useful, but it's incomplete. If all you ever compare against is your own history, you can end up celebrating average work or panicking over normal variance.
That's like an athlete reviewing only their own game film and never looking at league standards. They might see improvement, but they still won't know whether they're competitive.
Why internal comparisons break down
In practice, internal baselines can mislead in two directions.
- False confidence: Your current ad beats your account average, so the team calls it a winner. But your account average may already be mediocre.
- False panic: A new ad looks worse than a past outlier, so it gets killed early, even though it's performing normally for its format or placement.
- Narrow learning: You keep recycling what worked before and miss patterns that are common across the wider market.
Harvard Business Review's article on creative benchmarking formalized a broader management idea back in 2000. Teams learn more when they compare practices beyond direct competitors and look for transferable methods. In paid media, that principle matters even more because creative performance is noisy. Modern creative benchmarking works best when it uses broad, aggregated, statistically grounded reference ranges across brands, placements, and spend levels, not anecdotal peer comparison.
What good benchmarking actually does
A strong benchmarking process answers three questions:
| Question | What it tells you |
|---|---|
| How does this ad compare to a validated baseline | Whether the creative is weak, average, or unusually strong |
| Where is the ad failing | Whether the issue is the opening, pacing, message, or CTA |
| What should change next | Which revision has the best chance of improving performance |
That last part matters most. Creative benchmarking is not a reporting exercise. It's an operating system for iteration.
Practical rule: If your benchmark only tells you whether an ad won or lost, it's too shallow to help your team make better ads.
That's why creative intelligence matters. A benchmark is only useful when it connects performance signals to the actual assets, messages, formats, and production decisions behind them. If you want a deeper view of that layer, AdStellar's explanation of ad creative intelligence is a useful companion.
Metrics That Matter More Than CTR
CTR gets too much attention because it's easy to understand. People saw the ad, some clicked, done. But CTR is a late read on a much earlier creative process. Before someone clicks, they have to stop, watch, and stay interested long enough to care.
That's why good creative benchmarking uses a layered attention funnel instead of a single scoreboard metric.
Read the ad in stages
One expert benchmark set recommends Hook Rate of 30%+ as good, Hold Rate of 25%+ as good, Thumb Stop Rate of 25%+ as solid, and CTR of 1.5%+ as solid. Those numbers matter less as isolated targets and more as a sequence.
Start with the first break in the funnel:
- Hook Rate tells you whether the opening earned attention.
- Hold Rate tells you whether the ad kept that attention.
- Thumb Stop Rate shows whether the format and opening were strong enough to interrupt scrolling.
- CTR tells you whether attention turned into intent.
When teams skip straight to CTR, they collapse several different problems into one label: “the ad isn't working.” That hides the underlying issue.
What each metric diagnoses
If Thumb Stop Rate and Hook Rate are weak, the opening likely isn't visually or conceptually strong enough. That usually points to the first frames, not the offer. The problem may be bland framing, slow starts, weak pattern interrupt, or a concept that reads like every other ad in the feed.
If Hook Rate clears the bar but Hold Rate drops, the ad opened well and then lost narrative momentum. That's a body problem. The viewer gave you a chance, then the pacing sagged, the proof arrived too late, or the message got repetitive.
If viewing metrics are healthy but CTR is soft, attention isn't becoming action. In that case, look at the CTA, the offer framing, or the transition from interest to next step.
Good benchmarking doesn't ask, “Did they click?” It asks, “At what moment did we lose them?”
CTR is still useful, just not alone
CTR still belongs in the framework. It just shouldn't run the meeting by itself.
A practical way to use it is as the final diagnostic layer in the creative itself, before you move to landing page and offer analysis. The same expert source notes that the CTA should appear explicitly at least twice in the creative, which is one of those simple production rules teams often ignore while chasing bigger creative overhauls.
For a more detailed breakdown of how these platform metrics show up in Meta reporting, AdStellar's guide to Facebook ad performance metrics is worth reviewing with your media buyer and creative lead together.
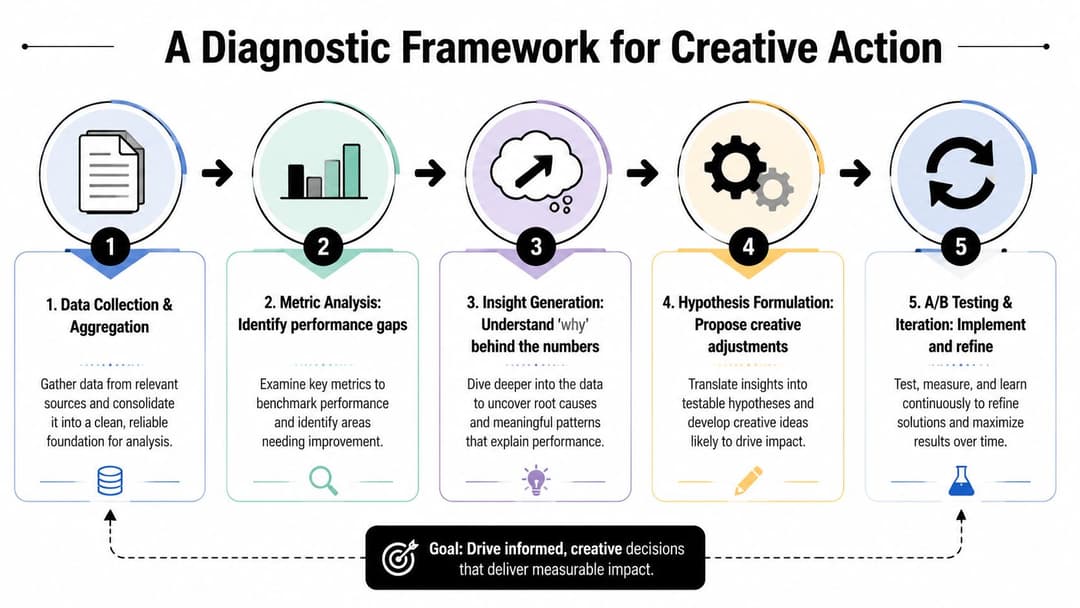
A Diagnostic Framework for Creative Action
Metrics only matter if they change what the team does next. The most useful form of creative benchmarking is diagnostic. It turns performance data into a targeted edit list.
That means you stop saying “make it better” and start saying “rewrite the first three seconds,” or “keep the hook, but rebuild the body with proof earlier.”
A simple read of the funnel
Use the metrics in order, not as a blended average.
Check the stop
Look first at whether the ad interrupts the scroll. If it doesn't, nothing downstream matters. Weak stop signals usually mean the creative needs a stronger opening visual, faster scene change, bolder on-screen claim, or clearer first-frame subject.
Check the hook
If the stop is acceptable but the hook is weak, the first spoken line or visual premise isn't earning curiosity. Here, generic intros hurt. Product explainers often fail here because they open with setup instead of tension.
Check the hold
If people stay for the opening and then leave, the ad likely has a pacing or structure problem. Strong hooks often hide weak bodies for a few seconds, which is why teams misread these ads as “almost there.” They're not. They need a rewrite in the middle, not a thumbnail tweak.
Check the click
If the ad holds attention but doesn't drive action, inspect the CTA and offer bridge. Sometimes the ad entertains without directing. Sometimes it creates curiosity but not buying intent.
Turn diagnosis into revisions
A lot of teams change too much at once. That makes learning slower.
Use a one-problem, one-fix approach:
| Signal pattern | Likely issue | Best next move |
|---|---|---|
| Low stop and low hook | Opening format is weak | Rebuild first frames and opening line |
| Good hook, weak hold | Body loses momentum | Tighten pacing and move proof earlier |
| Good viewing, weak CTR | CTA or intent bridge is weak | Rewrite call to action and offer framing |
| Strong creative signals, poor business result | Problem may sit outside the ad | Review audience, landing page, or offer fit |
Working advice: Don't edit the whole ad because one number is ugly. Edit the part of the ad that matches the failure point.
Build a repeatable review habit
The best teams review creatives the same way every week. They don't reinvent the scoring system every launch.
A practical review loop looks like this:
- Group by format: Compare UGC to UGC, statics to statics, founder videos to founder videos.
- Flag the break point: Note the first metric where the ad meaningfully falls off.
- Write one hypothesis: “The opening visual doesn't signal benefit fast enough” is useful. “Audience didn't like it” is not.
- Launch a focused variant: Change the hook, pacing, or CTA based on the diagnosis.
- Track the pattern: If the same failure repeats across several ads, fix the production brief, not just the asset.
If your team needs a more disciplined test structure around this process, AdStellar's framework for Facebook ad creative testing maps well to a benchmark-led workflow.
Putting It in Context with Industry Benchmarks
A diagnostic framework helps you find the problem. Benchmarks help you judge how serious that problem is.
Without external context, teams often overrate decent ads and underrate rare winners. That's expensive. You either scale mediocre creative too long or cut promising work too early.
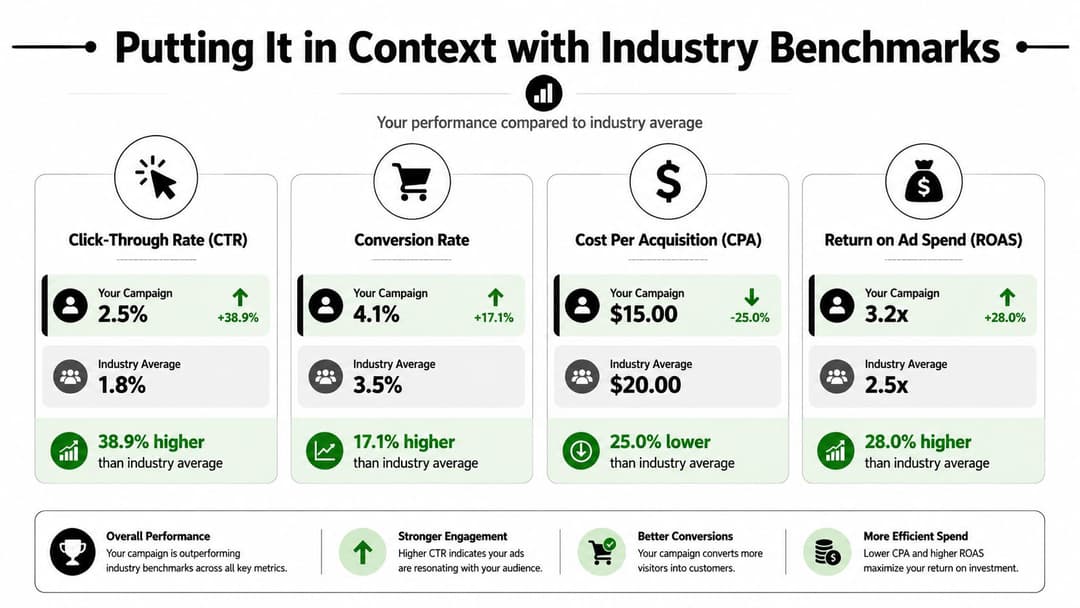
What normal looks like
Motion's 2026 benchmark analysis reports that only about 5% of ads spend at least 10× their account median, while average paid-social CTRs typically fall between 0.9% and 1.6%, CPCs often sit between $0.40 and $1.20, and healthy conversion rates are usually 3% to 6%.
That's a useful calibration point for creative benchmarking.
Most ads are not breakout winners. Most live in the middle. If a creative lands inside average benchmark ranges, that doesn't automatically make it a scale candidate. It may be functioning normally.
Average is not the same as scalable
Newer marketers often fall into a specific trap. An ad with acceptable CTR and conversion rate can still be ordinary in the context of a broader testing program.
Think of benchmark ranges as league averages. They tell you whether the ad is competent. They do not tell you whether it deserves more budget than the rest of the batch.
Use benchmarks in two layers:
- Baseline layer: Is this creative below, within, or above normal paid-social performance ranges?
- Portfolio layer: Among our current ads, which ones are showing the strongest signs of earning sustained budget?
That second question matters because scale comes from concentration. A small set of creatives usually carries disproportionate weight in the account.
The benchmark tells you what “good enough” looks like. Your testing system tells you which ad deserves the next dollar.
How to use the numbers without becoming rigid
Benchmarks are reference points, not commandments.
A practical use case looks like this:
- CTR in range, weak hold: The ad may be click-capable but structurally fragile.
- CPC looks fine, conversion rate weak: The ad may be attracting curiosity more than qualified intent.
- Conversion rate healthy, spend doesn't build: The platform may not view the creative as strong enough to keep prioritizing.
That's why external context is so useful. It stops the team from overreacting to one metric and helps you judge the full picture more realistically.
If you want a benchmark view specifically through a Meta ads lens, AdStellar's summary of Meta ads performance benchmarks is a practical reference for account reviews.
Common Creative Benchmarking Pitfalls to Avoid
Most benchmarking systems don't fail because the team lacks data. They fail because the team reads the wrong signal at the wrong time.
The biggest mistake is treating outcome metrics as early creative truth. ROAS and CPA matter to the business, but they're messy inputs for diagnosing whether the ad itself is strong.
Pitfall one using ROAS as a creative score
Creative-level diagnostics and business outcomes are not the same thing.
Motion's 2026 methodology argues that creative benchmarking works best when it separates creative diagnostics from metrics like ROAS or CPA, and it defines a winner as a creative that receives at least 10× the account median spend, using spend concentration as a proxy for Meta's prioritization of stronger assets.
That logic is useful because realized spend can tell you whether the platform keeps choosing the asset. Early CPA often can't tell you that cleanly.
Pitfall two comparing unlike with unlike
A broad benchmark doesn't give you permission to compare everything to everything.
Avoid these mismatches:
- Different formats: A short UGC clip and a static product image don't fail in the same way.
- Different placements: Feed behavior and story behavior aren't interchangeable.
- Different intents: Prospecting creative and retargeting creative should not be graded on the same expectations.
When marketers skip this step, they think they're being data-driven. They're just mixing contexts.
Pitfall three collecting data without decisions
Some teams build dashboards so detailed that nobody can act on them. Every metric has a chart. Every chart has a filter. Nothing gets fixed.
Keep the workflow tight:
- Pick the first failure point
- Write one creative hypothesis
- Test one meaningful revision
- Review again
If your team keeps making gut calls even with dashboards in place, the issue usually isn't reporting depth. It's decision discipline. AdStellar's piece on the lack of data-driven creative decisions captures that operational gap well.
Streamline Benchmarking with AdStellar AI
Manual creative benchmarking sounds clean on a whiteboard. In a real account, it gets messy fast. You have dozens of assets, shifting audiences, several angles, and a platform that keeps redistributing spend before the team finishes debating yesterday's report.
That's where teams often make a bad assumption. They assume better benchmarking means more spreadsheets.
It usually means the opposite. Better benchmarking comes from tighter systems that aggregate performance, normalize comparisons, and surface the few insights worth acting on.
Why automation matters in creative review
The hard part isn't understanding the logic. It's running the logic consistently at scale.
A useful system should help your team:
- Aggregate asset-level signals across campaigns without manual cleanup
- Connect creative patterns to outcomes so you can see which hooks, messages, and audiences repeat
- Shorten the feedback loop between launch, diagnosis, and iteration
- Reduce opinion debt inside the team by grounding reviews in observable signals
That's where AdStellar AI fits. It's built for teams that need to launch, test, and scale Meta campaigns faster while learning from the creative data they already produce. Instead of treating every launch as a fresh guessing exercise, it uses connected performance history and AI-driven analysis to rank creatives, audiences, and messages against account goals.
A strong explanation of that operating model is AdStellar's continuous learning system, which shows how the platform keeps improving recommendations as new campaign data flows in.
From reporting lag to feedback loop
A key benefit of a tool like this isn't that it “does AI.” Plenty of tools say that. Its main strength is operational. It helps marketers move from scattered observations to a repeatable decision cycle.
That cycle looks like this in practice:
- Launch many structured creative variations quickly.
- Watch how spend and engagement concentrate.
- Identify which assets, messages, and audiences earn stronger continuation.
- Feed those learnings into the next round without rebuilding the process manually.
Here's a quick walkthrough of the platform in action:
That's the point of creative benchmarking when it's done well. Not more reporting. Faster, clearer decisions about what to keep, what to cut, and what to make next.
AdStellar AI helps performance teams turn creative benchmarking into execution. If you want to launch more variations, spot winners faster, and scale Meta campaigns with less manual work, explore AdStellar AI.