You open Ads Manager at 9:12 a.m. CTR looks fine. GA4 shows traffic. Shopify has a few orders. Slack is already asking whether to raise budget on the new creative set.
That is the point where weak reporting creates expensive decisions.
Campaign dashboards are full of activity metrics that make a campaign look alive while the real question stays unanswered: should this budget keep running today? Teams that wait for end-of-week ROAS or blended CAC usually learn the lesson after the waste. In AI-driven campaigns, that lag hurts more because platforms generate and rotate variations faster than a human review cycle can keep up.
The better approach is to treat campaign metrics as an early warning system, not a scoreboard. Delivery, click quality, hold rate, bounce rate, landing page behavior, add-to-cart rate, lead quality, and conversion path drop-off all show whether a creative is pulling in the right attention or just cheap attention. They are not final business outcomes, but they help catch bad creative-audience fit before spend piles up.
That same discipline applies outside paid social. If you're trying to understand AI search measurement, raw visibility data still needs context from quality signals and downstream outcomes. The pattern is the same. Early movement matters only if it points toward revenue, pipeline, or qualified demand.
Good operators do not ask for more metrics. They ask which signals help them cut losers early, fix what is salvageable, and put more budget behind the combinations that are showing real buying intent.
Beyond the Dashboard Daze
A lot of marketers still treat campaign performance metrics like an autopsy. They wait until a campaign has spent enough money to become “statistically meaningful,” then review the result. That sounds disciplined. In practice, it often means letting weak creatives keep spending because nobody had a rule for acting sooner.
Why lagging metrics create expensive blind spots
ROAS, CAC, and total conversions matter. They also arrive late. By the time a campaign posts a bad aggregate result, the underlying issue has usually been visible for days.
A common pattern looks like this: an ad gets solid click volume, comments come in, and the team assumes the message is landing. But the landing page doesn't convert, or the audience is curious rather than qualified. The dashboard says “engagement.” The business result says “waste.”
Practical rule: A campaign can look alive at the ad level while failing at the business level.
That's why the first few days matter so much. The goal isn't to predict the exact final result with perfect certainty. The goal is to catch obvious mismatches before they drain budget.
What better monitoring looks like
Strong operators read campaign performance metrics in sequence, not isolation. They ask:
- Are people seeing it? If not, delivery or targeting may be the issue.
- Are people clicking? If not, the creative or offer likely isn't resonating.
- Are clickers converting? If not, the promise in the ad and the experience after the click aren't aligned.
- Is revenue following? If not, the campaign may be producing low-intent traffic.
That shift changes how you manage volume-heavy testing. If you launch dozens or hundreds of AI-generated variations, you can't review every ad like a handcrafted asset. You need a triage mindset. Some creatives earn more budget. Some need revision. Some should be cut fast.
Campaign performance metrics only become useful when they help you make one of those decisions.
The Four Tiers of Campaign Metrics
Most metric lists are just acronym soup. A better way to use campaign performance metrics is to group them by job. I think of them like building a house. You start with the foundation, then the frame, then the rooms, then the property value.
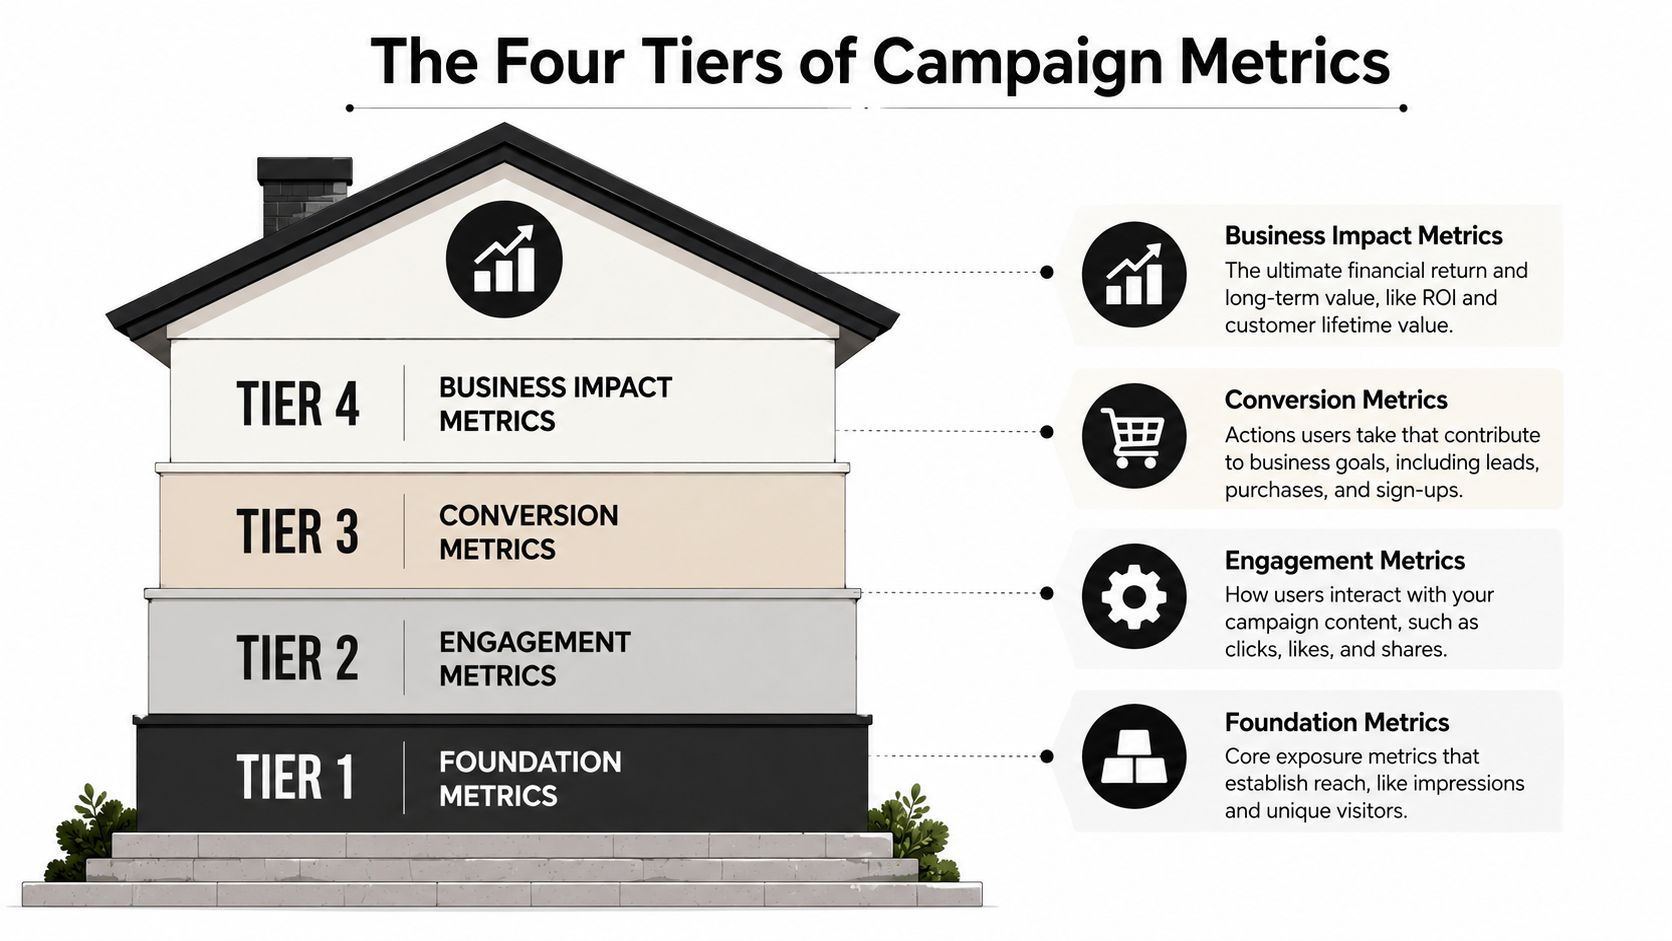
Tier 1 with foundation metrics
Foundation metrics tell you whether your campaign had a chance to work at all. This is reach, impressions, and other exposure signals. They don't prove business impact, but they tell you whether the campaign is entering enough auctions and getting seen by the right people.
If this layer is weak, don't waste time debating ad copy nuances. Fix delivery, audience size, or bidding conditions first.
Here's the catch. Teams often stop here because these metrics are easy to access and easy to present. They look neat in a dashboard. They also create false confidence when they aren't connected to the next layer.
Tier 2 with engagement metrics
Engagement metrics show whether the market is reacting to what you put in front of it. Clicks, CTR, reactions, saves, shares, and video engagement live here.
CTR serves as a useful diagnostic. According to Madgicx's campaign performance analytics guide, a CTR below 0.5% is a universal warning sign that creative assets must be refreshed. That's not a small optimization note. It's a message that the ad probably isn't resonating.
If nobody clicks, the rest of the funnel never gets a chance to prove anything.
Use engagement metrics to judge message-market fit, not campaign success in isolation. A high CTR can still send weak traffic. A low CTR usually means the ad itself needs work.
If you want a practical companion for this layer, this guide on measuring lead generation performance is useful because it connects top-of-funnel interaction to form and landing page outcomes rather than treating clicks as a win by themselves.
For a platform-specific breakdown, the AdStellar article on Facebook ad performance metrics explained gives a good reference for how these signals show up inside Meta reporting.
Tier 3 with conversion metrics
At this stage, attention turns into action. Leads, purchases, trials, demo requests, and sign-ups belong here. Conversion metrics answer whether traffic quality matches campaign intent.
Think of this tier as the finished rooms in the house. The frame may look solid, but if the rooms don't function, nobody wants to live there.
A few practical reads matter here:
- High engagement plus weak conversion usually means the ad promise and landing page don't match.
- Decent conversion rate with poor volume may point to a reach or traffic problem.
- Strong front-end conversions with poor downstream quality often means the audience is too broad or the offer attracts the wrong people.
Tier 4 with business impact metrics
The top tier tells you whether the campaign deserves more investment. Revenue efficiency, margin logic, and longer-term value are considered. If the lower tiers explain behavior, this tier explains business viability.
A useful mental model looks like this:
| Tier | What it tells you | Typical mistake |
|---|---|---|
| Foundation | Did the campaign get seen? | Treating reach as success |
| Engagement | Did the message spark action? | Confusing clicks with intent |
| Conversion | Did users take the desired step? | Ignoring post-click friction |
| Business impact | Did the campaign create profitable growth? | Looking here too late |
The mistake isn't using top-tier metrics. The mistake is jumping straight to them and skipping the layers that explain why results are moving. Strong operators read from the bottom up when planning, and from the top down when diagnosing.
Aligning Metrics with Your Campaign Objective
There isn't one best metric. There's only the right metric for the job.
Teams get in trouble when they apply the same success criteria to every campaign. A prospecting campaign for a new product launch shouldn't be judged by the same standard as a retargeting campaign aimed at recovering abandoned carts. One is opening the door. The other is trying to close it.
Match the KPI to the buying stage
A campaign objective should decide the primary KPI. Everything else is supporting evidence.
If the goal is awareness, your lead metric is exposure and message interaction. If the goal is lead generation, the campaign lives or dies on cost efficiency and lead quality. If the goal is direct response revenue, revenue efficiency becomes the main scorecard.
The AdStellar post on the objective of a campaign is a useful reminder that objective-setting isn't admin work. It determines what you optimize, what you ignore, and what you report upward.
Mapping objectives to primary metrics
| Campaign Objective | Primary Metric (KPI) | Secondary Metrics |
|---|---|---|
| Brand awareness | Reach or impressions | CTR, engagement quality, landing page behavior |
| Traffic generation | CTR or landing page visits | Conversion rate, CPC, on-site engagement |
| Lead generation | CPL or CAC | CTR, landing page conversion, lead quality |
| E-commerce sales | ROAS | CPA, conversion rate, CTR |
| Retargeting | ROAS or CPA | Frequency, conversion rate, audience saturation |
| Product launch testing | Early creative diagnostics | CTR, post-click conversion behavior, qualitative audience response |
When ROAS should lead, and when it shouldn't
For paid social and display campaigns tied to revenue, ROAS is the definitive revenue-efficiency metric. The InfluenceFlow guide to campaign performance metrics states that a ROAS above 2:1 is the minimum threshold for a campaign to be considered working, while top-performing campaigns often achieve 6x or higher before triggering automatic budget scaling.
That's useful guidance for sales-focused campaigns. It is not a universal standard for every objective.
A top-of-funnel awareness campaign can be doing its job even if short-term ROAS looks weak. On the other hand, a bottom-funnel retargeting campaign with weak ROAS doesn't get much benefit of the doubt because the audience already knows you.
Judge campaigns by the business outcome they were hired to produce, not by the metric that happens to be easiest to export.
A simple decision filter
When choosing campaign performance metrics, ask three questions:
- What action do we want now? A click, a lead, a purchase, or attention.
- How quickly should this campaign produce that action? Immediate-response campaigns need tighter short-term metrics.
- What signal would tell us to intervene early? Every campaign needs a leading indicator, not just a final KPI.
That last question is where many teams improve fastest. The final KPI keeps you honest. The leading indicator keeps you efficient.
How to Set Meaningful Performance Benchmarks
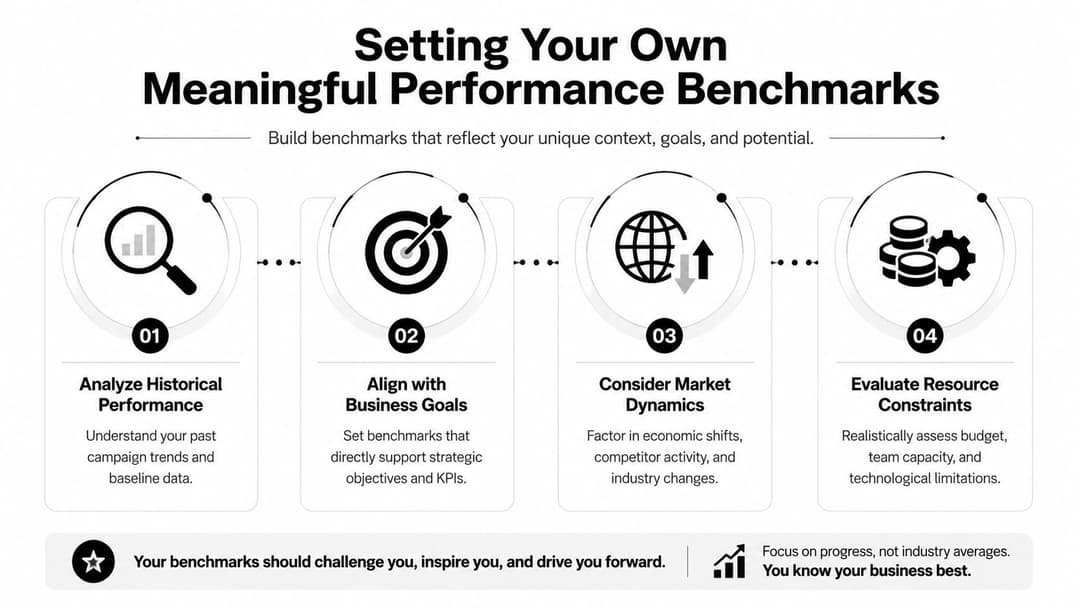
Generic benchmarks are comforting and often useless. They flatten important context. Your offer, price point, audience maturity, sales cycle, and tracking setup all change what “good” looks like.
Meaningful campaign performance metrics come from your own account history, not from a random screenshot on LinkedIn.
Build a benchmark from your own operating reality
The benchmarking approach I trust most starts with a rolling historical window, then strips out distortions. According to Cometly's benchmark guide, reliable campaign benchmarks require a 90-day rolling measurement window to calculate internal performance floors and ceilings for metrics like CPL and CAC.
That matters because averages can lie. A product launch, a seasonal spike, or a promotional burst can make your baseline look healthier or worse than normal. A rolling window gives you something more durable.
The article on Meta ads performance benchmarks is worth reviewing alongside this because platform-specific benchmark reading only works when it's grounded in your own campaign context.
What a good internal benchmark process includes
A solid process usually has these parts:
- Use a rolling view: Review enough historical data to smooth out one-off spikes.
- Remove anomalies: Product launches, flash promotions, or tracking outages can distort benchmarks.
- Segment by campaign type: Prospecting, retargeting, lead gen, and catalog sales shouldn't share one benchmark.
- Compare medians, not just averages: Outliers can make average performance look better than what you usually achieve.
The key idea is simple. Benchmarks should help your team make decisions under normal operating conditions, not impress stakeholders with cherry-picked winners.
Tracking quality changes the benchmark itself
A lot of teams inadvertently sabotage their own decision-making. If tracking misses conversions, your benchmark doesn't become conservative. It becomes wrong.
Cometly also notes that integrating server-side tracking via Meta's CAPI typically recaptures 15-20% more conversion events and recalibrates ROAS benchmarks upward by 10-15%. That's a technical detail with strategic consequences. If browser-based tracking undercounts results, operators may pause or cut campaigns that are performing well.
Bad tracking doesn't just blur reporting. It teaches the team the wrong lessons.
When leadership asks, “What's a good CPL for us?” the best answer isn't an industry benchmark. It's your median performance over a clean historical window, segmented by campaign type, informed by complete enough tracking to trust the signal.
A practical benchmark checklist
| Benchmark step | What to look for |
|---|---|
| Historical window | Use a rolling period long enough to reduce noise |
| Campaign grouping | Separate by objective, funnel stage, and audience type |
| Data hygiene | Exclude anomalies and tracking failures |
| Tracking setup | Validate server-side capture and attribution consistency |
A benchmark should make action easier. If it doesn't help you decide whether to scale, hold, refresh, or cut, it isn't a useful benchmark yet.
Building Reports That Drive Decisions
A report is only good if someone can act on it.
Too many campaign reports are just exports with branding. They show spend, impressions, clicks, conversions, and maybe a trend line. Nobody reading them knows what changed, why it changed, or what the team should do next.
The report should answer four questions
A useful campaign report follows a simple narrative:
- What was the goal?
- What happened against that goal?
- Why did it happen?
- What are we doing next?
That structure keeps campaign performance metrics tied to action. It also makes the report easier for non-specialists to follow. A founder, CMO, or client doesn't need every diagnostic metric. They need the metrics that explain the decision.
If you're reworking your reporting stack, this comprehensive guide on KPI dashboards is a helpful companion because it focuses on dashboard design as a decision tool rather than a visual archive.
What to include and what to leave out
Many teams need fewer numbers on the page, not more.
A decision-ready report usually includes:
- Primary KPI first: Lead with the metric tied to the campaign objective.
- Diagnostic support: Add the few supporting metrics that explain movement.
- Segmented winners and losers: Show which creatives, audiences, or placements deserve action.
- Next step owner: End with a clear change, not a vague observation.
Avoid stuffing in vanity metrics just because the ad platform offers them. If a metric doesn't help explain performance or guide the next move, it belongs in backup tabs, not the executive summary.
A practical reporting template
| Report section | What belongs there |
|---|---|
| Goal | Campaign objective and success metric |
| Outcome | Current result versus target or internal benchmark |
| Diagnosis | The few metrics that explain the result |
| Action | Budget shifts, creative refreshes, audience changes, or landing page fixes |
The AdStellar guide on how to automate Facebook ad reporting is relevant here because the reporting problem usually isn't access to data. It's the manual effort of turning scattered platform outputs into a coherent story.
A reporting system should reduce decision time. If it creates more meetings, it's failing.
Why narrative beats data dumps
People act on clarity, not volume. When a report says, “CTR held up, post-click conversion lagged, landing experience likely caused the drop, so we're refreshing the page and holding spend steady,” everyone knows what happens next.
When a report says, “Here are thirty-two metrics by ad set,” the team usually argues about interpretation and delays action.
The best campaign performance metrics are the ones that survive contact with a real decision.
Optimizing Campaigns with Predictive Insights
You launch 40 new AI-generated ad variations on Monday. By Wednesday, spend has concentrated into a handful of ads with strong click-through rates. By Friday, pipeline quality is soft, conversion rates are uneven, and half the budget is already gone. The problem was not visibility. The problem was waiting for lagging metrics to confirm what early diagnostic signals were already showing.
That is the operating challenge now. AI can create and test creative combinations faster than a team can review them manually, so campaign management has to shift from outcome reporting to pattern detection. Teams that spot weak combinations early cut waste sooner. Teams that rely on end-of-week summaries usually pay to learn the same lesson more slowly.
Early signals that deserve action
Predictive optimization works best when metrics are read together. CTR on its own can flatter a weak campaign. Conversion volume on its own can hide whether the issue sits in the ad, the audience, or the landing page. The signal worth acting on is the combination.
The predictive modeling framework for marketers explains the underlying logic. In practice, the job is simpler than the terminology suggests. Look for metric patterns that tend to show up before wasted spend becomes obvious.
A common one is this: strong engagement, weak post-click performance. That usually means the ad is making a promise the landing page does not cash. Another is low CTR paired with acceptable conversion rate from the small group that does click. That often points to a creative or hook problem, not an offer problem. These are the signals that help teams cut underperformers before platform automation keeps feeding them spend.
Turn signals into operating rules
Useful predictive insight needs a response attached to it. Otherwise it stays interesting and never becomes useful.
- Low CTR and weak thumb-stop rate: refresh the creative first. The message is not earning attention.
- Strong CTR and weak landing page conversion: check message match, page speed, offer clarity, and audience intent before increasing spend.
- Healthy lead volume and poor downstream quality: tighten targeting, qualify harder in the form, or change the promise in the ad.
- Strong revenue efficiency across several days: raise budget in controlled steps and watch for efficiency decay, not just volume growth.
Trade-offs are critical. Cutting too early can kill a creative that needed more delivery to stabilize. Waiting too long lets automated bidding spend through a bad pattern. Good operators set review thresholds by campaign type, sales cycle, and conversion volume so they can act quickly without chasing noise.
Ask what the current metric pattern suggests will happen next, then choose the cheapest test that can confirm or disprove it.
The shift that improves performance
The practical upgrade is a live triage system. Scoreboards tell you what happened. Predictive signals help you decide what to pause, what to fix, and what to scale while there is still time to change the result.
That matters even more in AI-driven accounts. More variations create more chances to find winners, but they also create more ways to waste budget on ads that look promising at the click level and fail after the click. Strong teams build simple decision rules around early signals, review them daily, and treat campaign metrics as an early warning system, not a postmortem.
If your team is launching lots of Meta variations and needs a faster way to spot winners, cut weak creatives, and act on real campaign performance metrics without drowning in manual analysis, take a look at AdStellar AI. It's built for operators who want clearer signals, faster testing, and more confident scaling.