You open Ads Manager on Monday morning and see purchase CPA jump from $28 to $41 over the weekend. Nothing obvious changed. The campaign is still spending, clicks are still coming in, and the creative that worked last week hasn't suddenly disappeared. The instinct is to lower the bid, narrow the audience, or shut everything down.
That reaction usually makes the diagnosis harder. CPA on Facebook isn't a universal price tag. It's an output produced by your campaign objective, auction conditions, audience, creative, conversion path, and measurement setup. A purchase CPA can't be judged against a lead CPA, and neither should be compared with an app install CPA without normalizing for the action and the economics behind it.
What CPA on Facebook Actually Means
CPA, or cost per acquisition, is the average amount spent to generate one defined conversion. The conversion might be a purchase, lead submission, app install, or another event selected for campaign optimization. Meta doesn't calculate a vague cost for “marketing success.” It calculates the cost of the event your campaign is designed to produce.
That distinction matters because the optimization event is usually selected at the ad set level. If you optimize for add-to-cart, Meta will seek people more likely to add products to a cart. If you optimize for purchase, the system is looking for people more likely to complete checkout. Those actions sit at different points in the funnel and carry different levels of friction.
Practical rule: Never ask whether your CPA is good before asking, “CPA for what event?”
CPA also differs from the metrics that appear beside it. CPM measures the cost of impressions. CPC measures the cost of clicks. CPA measures the cost of the final tracked action. A campaign can have an expensive CPC and still produce an efficient CPA if the traffic converts well. Conversely, cheap clicks can create a poor CPA when the landing page, offer, or checkout fails to convert.
The relationship is simple in principle. Meta buys impressions in an auction, your creative persuades some people to click, and your post-click experience persuades some of those visitors to complete the chosen action. CPA reflects the combined result.
That's why reading CPA in isolation leads to bad decisions. A rising CPA can come from higher media costs, weaker creative response, audience saturation, lower conversion quality, or missing conversion events. The number tells you that the outcome changed. It doesn't tell you which lever caused the change.
Treat CPA as an output, not an input. You don't improve it by staring at the column or forcing it lower with arbitrary bid changes. You improve the underlying system that produces the conversion.
How Meta Calculates and Reports CPA
The basic calculation is direct:
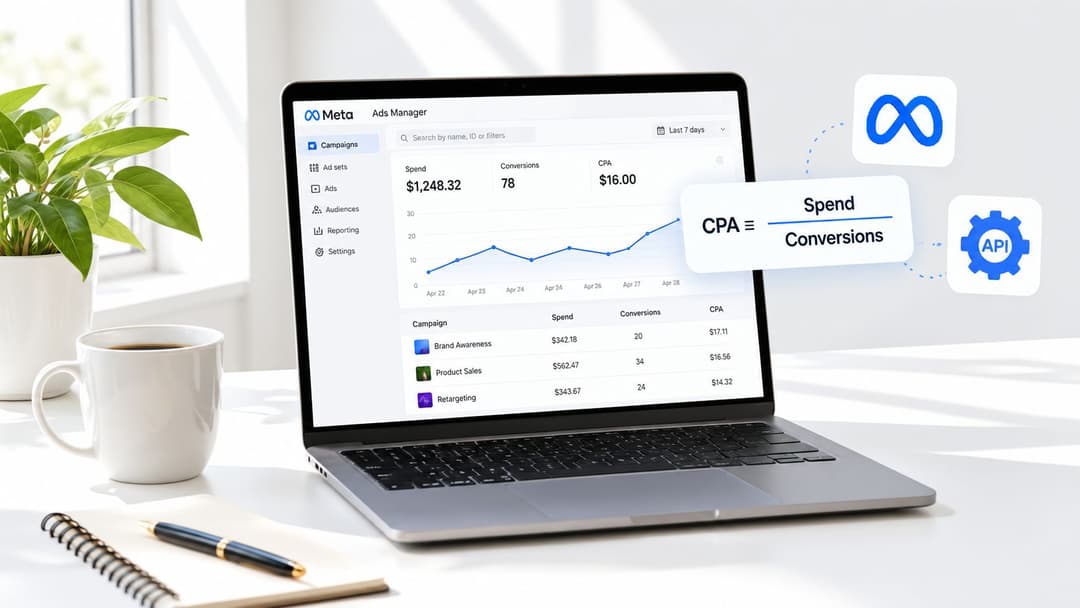
CPA = total ad spend ÷ total optimization events
If an ad set spends $1,000 and records 25 purchase events, the reported purchase CPA is $40. The result depends entirely on the denominator. Change the event, attribution setup, or event reporting, and the CPA can change even when the amount spent stays constant.
Meta generally surfaces this figure through the Cost per result column in Ads Manager. Open the campaign or ad set view, select the columns dropdown, and customize the reporting view if the relevant result isn't visible. For purchase campaigns, add a result column such as Website Purchases so you can compare the headline result with the underlying action count.
The event can come from the Meta Pixel, Conversions API, or an on-platform action such as an instant form submission. Teams using both browser and server events need clean deduplication. If the browser and server send the same conversion without a reliable event identifier, the platform can miscount results. For implementation differences between browser and server tracking, review this guide to Conversions API versus Meta Pixel.
Why reported CPA and internal CPA diverge
Your finance or analytics team may define CPA differently from Ads Manager. Internal acquisition cost might include agency fees, creative production, discounts, sales costs, or only approved purchases. Meta's figure typically reflects the spend and result definition selected in the account interface.
Attribution windows also affect the comparison. Conversion event priority, reporting delays, and deduplication rules can produce different totals between Meta, a backend database, and an analytics platform. Decide which number governs optimization and which number governs profitability. They don't need to match perfectly, but unexplained divergence needs investigation.
Switching the conversion event during a live campaign creates another reporting trap. If an ad set moves from add-to-cart to purchase, the denominator changes immediately while the campaign may have limited recent purchase history. CPA can look temporarily inflated because the new event has fewer recorded outcomes.
The Results page can also layer related actions, such as website purchases, alongside the primary result. Use those supporting actions diagnostically, not as substitutes for the event you chose to optimize.
Meta reports the main CPA at the ad set level, while creative performance requires a breakdown into ads. Compare spend, impressions, clicks, landing-page views, and conversions by creative before declaring that one ad caused the change.
CPA Benchmarks by Industry in 2026
A platform-wide average is a weak planning tool. Independent benchmark reporting in 2026 placed average Meta and Facebook ads CPA at $38.19, up 1.0% from a 2025 baseline of $37.80. The same dataset reported a 2025 all-industry median CPA of $38.17 across more than 35,000 ad accounts, which shows how a broad platform number can sit in the high-$30s before industry economics enter the discussion. See the Meta Ads performance benchmarks for broader context.
Historical WordStream data makes the vertical spread clear. Its all-industry Facebook CPA average was $18.68, while education averaged $7.85, healthcare $12.31, fitness $13.29, real estate $16.92, finance and insurance $41.43, and home improvement $44.66. Those figures aren't interchangeable targets. They demonstrate that Facebook CPA is structurally shaped by the economics and competition of each category. WordStream's Facebook advertising benchmarks provide the underlying historical comparison.
Recent benchmark reporting also places median Meta and Facebook CPA around $38.17 to $38.99 across large account datasets, with ecommerce near the low $20s and technology and finance above $50 in some distributions. The practical conclusion is straightforward: auction pressure and downstream conversion economics matter more than a universal platform average. Triple Whale's Meta ads benchmark analysis captures that vertical dependence.
| Industry or objective | Purchase CPA | Lead CPA | App install CPA |
|---|---|---|---|
| Ecommerce | Low-$20s in some benchmark distributions | Not directly comparable | Not applicable |
| Education | $7.85 historical benchmark | Objective dependent | Not applicable |
| Healthcare | $12.31 historical benchmark | Objective dependent | Not applicable |
| Finance and insurance | $41.43 historical benchmark | Objective dependent | Not applicable |
| Home improvement | $44.66 historical benchmark | Objective dependent | Not applicable |
| Technology | Above $50 in some benchmark distributions | Objective dependent | Not applicable |
The table is intentionally conservative because the verified data doesn't support a fabricated 2026 range for every vertical and objective. One benchmark guide reports an average CPA of $18.68 with a $7.85 to $55.21 spread, another reports lead campaigns at $12.80 and conversion campaigns at $18.40, and another reports a median of $38.99 across industries. Those figures describe different datasets and objectives, so combining them into one “average” would mislead you. The objective-specific Facebook ads cost analysis explains why traffic, lead, and purchase campaigns need separate evaluation.
Your acceptable CPA should therefore start with unit economics, not a search result. High-LTV businesses can tolerate a higher acquisition cost when later revenue supports it. Thin-margin businesses need tighter control because a small increase in acquisition cost can erase contribution margin. Audience quality, creative maturity, funnel friction, and seasonality can also move results substantially within the same category.
Is a Good CPA Actually Good
The lowest CPA isn't automatically the best result. A cheap conversion can be a low-value lead, a discount-driven purchase, or an unqualified signup that never produces revenue. A higher CPA can be healthier when the acquired customer buys more, stays longer, or generates stronger gross margin.
Judge CPA against the value created after acquisition:
- Customer lifetime value: Compare the expected contribution from the customer over the relationship, not just the first transaction.
- Average order value: A purchase CPA needs to fit the value of the order it creates.
- Gross margin: Revenue doesn't equal usable profit. Product costs, fulfillment, refunds, and discounts reduce what remains to fund acquisition.
- Funnel quality: A low lead CPA means little if sales rejects most of the leads.
The commonly used 3:1 LTV-to-CPA rule can provide a useful starting framework, but it isn't a law. A business with substantial service, fulfillment, or support costs may need a stronger ratio. A business with predictable renewals may accept a weaker first-order ratio if retention is proven.
Consider two outcomes. A $4 lead CPA can be excellent for a service business selling a $2,000 engagement, provided the lead is qualified and the sales process converts it. A $40 purchase CPA can be destructive for an ecommerce product with a $30 average order value, especially when the gross margin is narrow. The number alone doesn't decide either case.
A practical classification
Label the result based on contribution margin per acquisition:
- Good: Contribution margin comfortably covers CPA and leaves room for operating costs and growth.
- Break-even: CPA consumes most or all contribution margin. The campaign may be useful for testing, but scaling it is unsafe.
- Bleeding: CPA exceeds the contribution available from the customer or produces leads that don't create qualified pipeline.
Don't optimize top-of-funnel CPA when your actual objective is revenue or qualified pipeline. A form campaign can lower reported CPA by making the action easier, while sales quality deteriorates. Teams evaluating external support can also compare their measurement discipline with a top Facebook Ads agency Brisbane, especially when lead volume and lead value need to be separated.
CPA is a constraint to satisfy, not a number to minimize at any cost. Set the maximum sustainable acquisition cost first, then use the auction and creative system to produce as many valuable conversions as possible within it.
Four Levers That Move CPA on Facebook
Many teams pull the wrong lever first. They change bids before fixing creative, narrow audiences before confirming signal quality, and blame the auction before checking event tracking. Use this order instead.
| Lever | Primary tactic | Metric to watch | Common mistake |
|---|---|---|---|
| Creative | Rotate distinct hooks and formats | CTR, conversion rate, CPA by ad | Editing one tired ad repeatedly |
| Audience | Begin broad, then add proven segmentation | CPA and conversion quality by audience | Over-narrowing before signal exists |
| Bidding | Match bid strategy to the optimization event | Delivery, spend, CPA stability | Using aggressive controls too early |
| Measurement | Reconcile Pixel and Conversions API events | Event match quality, deduplication, backend conversions | Optimizing against incomplete data |
Creative comes first
Treat creative as perishable inventory. A winning ad can lose attention as the same audience sees it repeatedly. Build different concepts, not cosmetic variations with the same opening, promise, and visual pattern. Test creator-led demonstrations, objection handling, product comparisons, problem-first hooks, and customer outcomes where the offer supports them.
The working metric is not just thumb-stop engagement. Watch whether a new concept improves click quality and downstream conversion. If CTR rises but purchase rate falls, the new hook may be attracting curiosity rather than intent.
Audience should support signal
Start broad with Advantage+ Shopping or broad targeting when the account has enough conversion signal to let Meta find patterns. Add interest stacks only when the results show a clear reason to do so. Value-based lookalikes seeded from repeat purchasers can be more useful than lookalikes built from one-time buyers when customer quality varies.
The proof is not audience size. Watch CPA alongside revenue quality, repeat behavior, or qualified lead rate.
Bidding needs restraint
Choose the event that represents the business outcome. For an ecommerce account, purchase is usually a more useful optimization event than add-to-cart when purchase volume and tracking quality support it. Begin with highest volume or a measured cost cap before reaching for tROAS controls that may restrict delivery.
When you change a cap, make gradual adjustments and let delivery produce enough evidence before making another change. A bid control can't manufacture demand or compensate for an exhausted creative set.
Measurement protects every decision
Verify that browser and server events represent the same user action without double counting. Check event identifiers, deduplication behavior, conversion event priority, and whether the server-side purchase event arrives reliably. If the data is incomplete, the algorithm is optimizing on a distorted denominator.
For broader operational guidance, review Meta ad delivery optimization. Teams also exploring automation to cut acquisition expenses should automate alerts and repetitive checks only after the underlying event definitions are trustworthy.
A Worked Example of Lowering CPA Step by Step
Consider a representative ecommerce brand selling a product with a $65 average order value and a starting $48 purchase CPA. The immediate question isn't “Which bid should we use?” The team first needs to establish whether the ad is losing attention, the audience is too expensive, or the measurement is incomplete.
The audit finds frequency above three in the top ad set. The team launches five new hooks rather than making minor edits to the existing winner. Within ten days, CPA falls from $48 to $34 as click-through performance recovers. The lesson is about sequence: the brand improved the ad's ability to earn attention before restricting the auction.
With conversion volume restored, the team changes bidding from highest volume to a cost cap set 15% above current CPA. Delivery tightens without imposing an unrealistic target, and purchase CPA moves to $29. This isn't proof that cost caps always improve results. It shows why bid controls work better after the creative has restored conversion signal.
The audience is the next constraint. The team replaces a 1% purchaser lookalike built from all buyers with a 5% value-based lookalike seeded by repeat purchasers. That expands reach while preserving a stronger quality signal, bringing CPA near $26.
The final step exposes a reporting problem. A Pixel and Conversions API deduplication gap had been undercounting conversions by about 12%. Correcting the event setup lowers the reported CPA further, but it doesn't create new customers. It aligns Ads Manager with the conversions the business was already receiving.
Use this order because each step answers a different question:
- Is the creative still earning attention?
- Can bidding control delivery after signal returns?
- Can the audience expand without degrading quality?
- Does measurement reflect the actual conversion count?
The image above is required only once in the article, so the process is best reinforced through the sequence rather than duplication.
For a deeper review of how to isolate these changes, use campaign performance analysis. Change one major variable at a time, preserve a control where possible, and record whether the improvement appears in CPA, conversion rate, customer value, or only reporting.
Diagnosing Why Your CPA Is Rising
A rising CPA is a diagnosis problem, not an automatic signal that Meta's algorithm failed. Start with the auction, then trace delivery, creative response, audience pressure, and attribution in that order. Broader causes of rising costs are covered in this Meta ads CPA inflation analysis.
Check CPM first. If CPM rises while CTR holds steady, the auction is costing more. Independent 2026 reporting described Meta ads CPA rising from $27.66 to $38.19, a 38.1% year-over-year increase, while another benchmark reported CPM growth of 13% year over year in Q2 2026. These findings make auction conditions a diagnostic category, not an excuse, as discussed in this Meta ads CPA inflation analysis.
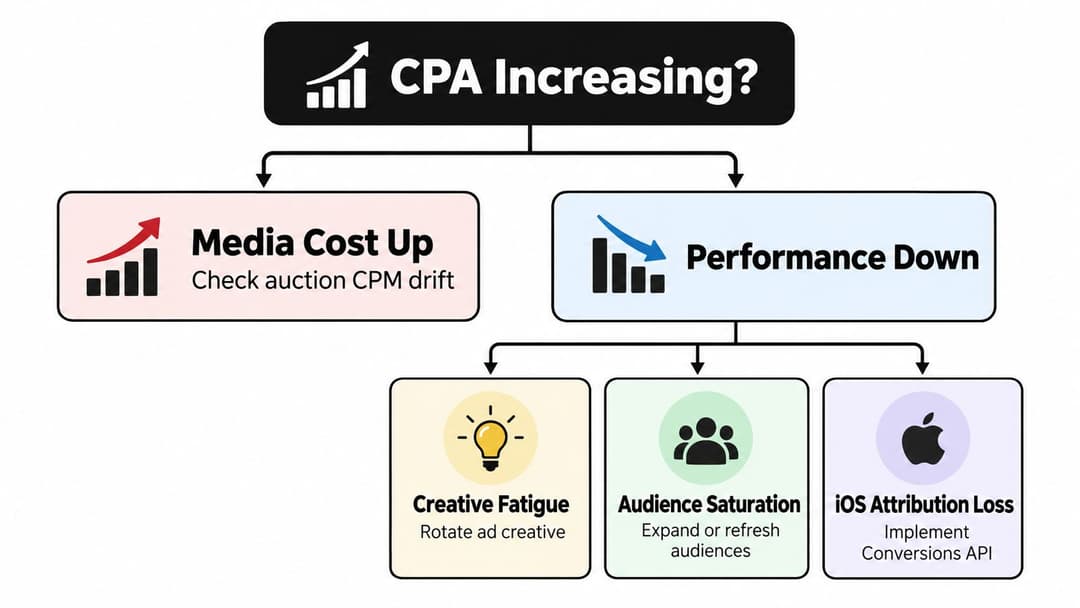
Use this decision path:
- CPM up, CTR stable: Auction pressure is the likely cause. Review seasonality, placement mix, audience overlap, and budget concentration before changing the creative.
- CPM stable, CTR down: Creative fatigue is more likely. Compare frequency, hook response, and link engagement by ad.
- CPA up without CPM movement: Check conversion rate, landing-page behavior, offer changes, checkout errors, and event delivery.
- Frequency above 2.5: Audience saturation needs attention. Refresh the creative and test broader delivery instead of narrowing the audience again.
- Browser results weaker than backend results: Audit Pixel and Conversions API coverage, event identifiers, attribution settings, and deduplication.
iOS measurement loss can reduce the conversions Meta associates with ad exposure, making performance look weaker than it is. Compare Ads Manager with backend purchases or qualified leads before changing the budget.
Run a fast triage within 48 hours:
- Pause bottom-performing creatives by CPA and conversion quality.
- Replace ad sets with new concepts, not minor copy edits.
- Isolate campaign-level budget so unstable ad sets remain visible.
- Recheck Pixel and Conversions API event quality.
- Compare CPM, CTR, conversion rate, frequency, and backend outcomes.
- Scale only after identifying the cause and confirming stable signal.
Do not raise bids to fix creative fatigue, broaden targeting to compensate for broken tracking, or refresh creative when checkout is failing. Identify the input that moved, then make the smallest change that addresses it.
AdStellar AI helps Meta teams generate and launch combinations of creative, copy, and audience variations, then rank results against CPA, CPL, or ROAS goals. Visit AdStellar AI to review its campaign workflows and performance insights for identifying fatigue and testing new combinations.