You can stare at Meta Ads Manager all morning and still end up with the same problem, the dashboard looks respectable, the team feels busy, and revenue barely budges. That's the gap campaign performance analysis is built to close, the difference between reporting numbers and making a decision that changes what happens next. The useful question isn't whether the account has traffic, clicks, or a tidy ROAS line, it's whether the campaign acquired customers at an acceptable cost and returned enough value to scale.
When the Dashboard Says Everything Is Fine
The campaign looked calm. CPMs stayed in range, CTR held steady, and Meta's reported ROAS never flashed a warning. On paper, it looked like the kind of account a stakeholder would skim, nod at, and move on from, because nothing appeared broken.
Then the business side called. Pipeline was flat, orders were soft, and the “healthy” dashboard had not turned into anything the company could feel. That mismatch is the reason campaign performance analysis matters, because a clean dashboard can still hide a weak business outcome.
Why platform comfort is a trap
Meta Ads Manager is good at showing what happened inside Meta. It is much less honest about what happened after the click, especially when attribution is assigning credit for you. If you stop at impressions, CTR, or even self-reported conversions, you are still reading a platform story, not a business verdict.
The better habit is to trace performance from impressions to revenue, then ask whether the campaign created enough value to justify the spend. Industry guidance treats CTR as the engagement signal, CPC and CPA as cost-efficiency signals, and ROAS as the revenue-return metric, with CPA and ROAS often carrying the most weight in optimization decisions because they connect media to business outcomes (Ryze on campaign performance metrics). That is why a campaign can look good and still fail.
A strong analyst also checks whether the platform story matches the business story outside Meta. If attributed conversions rise but revenue, qualified pipeline, or repeat purchases do not move with them, the issue is usually not the dashboard, it is the measurement model, the offer, or the quality of the traffic being counted.
Practical rule: if the numbers make the dashboard feel safe but the business feels flat, trust the gap, not the chart.
What a real analysis is supposed to produce
A useful readout does not end with “CTR is up.” It ends with a decision, cut one ad, shift budget, tighten the audience, fix tracking, or leave the setup alone because the issue is not in the media. That decision-making mindset is the historical shift from reporting toward analysis, and it is why modern measurement leans on normalized cross-channel comparison rather than platform-native snapshots (ClicData on analyzing campaign performance).
The most practical benchmark in day-to-day work is simple. Compare actuals against plan and treat a deviation of roughly 20% or more as diagnosis territory, then figure out whether the gap comes from creative fatigue, audience saturation, tracking breaks, or channel weakness. That is the difference between glancing at performance and managing it.
Defining the KPIs That Drive Decisions
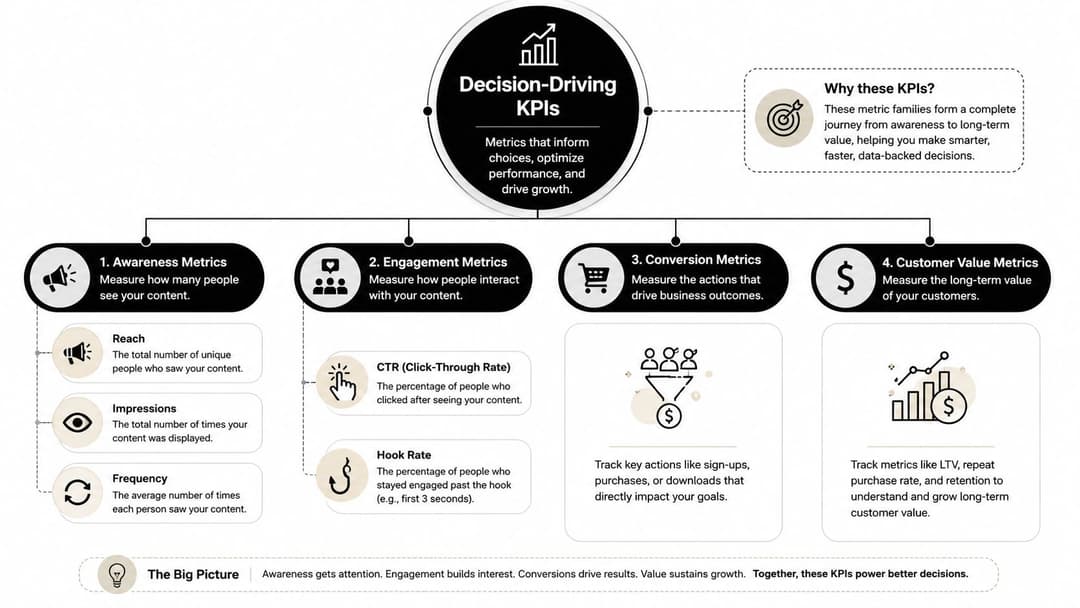
Most accounts do not have a metric problem. They have a decision problem. The dashboard fills up fast, but only a small set of numbers should determine whether you cut spend, keep testing, or leave the setup alone.
The four families that matter
Awareness metrics show whether the campaign is getting seen. In Meta, that usually means reach, impressions, and frequency. These are useful because they describe exposure, but they do not tell you whether the media is working. A higher reach line can be acceptable, or it can mean you are buying more eyeballs while efficiency slips.
Engagement metrics show whether the creative is earning attention. CTR is the cleanest read here, and video-heavy accounts may also watch hook rate. These numbers are diagnostic, so they help explain why downstream performance changed, but they do not justify scale on their own.
Conversion metrics are the first group tied directly to business intent. Conversion rate, CPA, and CPL belong here. They show whether interest became a real outcome, and they are usually where optimization gets serious, because a campaign that collects clicks without producing outcomes is active, not healthy.
Efficiency metrics sit at the return layer. ROAS and ROI answer a simple question, did the spend generate enough value to justify itself. For analysis like this, it helps to compare the platform view with the broader measurement picture, which is why a campaign metrics framework is useful when you are sorting signal from noise.
Practical rule: keep awareness metrics in view, but let conversion and efficiency metrics make the call.
What to watch, and what to act on
The split that matters is cost-efficiency versus volume. CTR, reach, and impressions can all improve while CPA gets worse. That is how teams end up scaling a campaign that looks busy and expensive at the same time.
Day-to-day management should focus on the KPIs tied to cost per outcome and revenue return. The monitoring metrics are the ones that warn you something is changing upstream, such as frequency or impressions. When actual results drift materially from plan, that is the point to diagnose the cause, whether it is creative fatigue, audience saturation, tracking issues, or a channel that is no longer pulling its weight. The rest of the dashboard should support that call, not compete with it.
A good analyst does not stop at the platform view. Meta Ads Manager can show attributed conversions and still leave the underlying business question unanswered, which is why attribution and incrementality have to sit inside the KPI discussion, not outside it.
Collecting and Cleaning Your Meta Ads Data
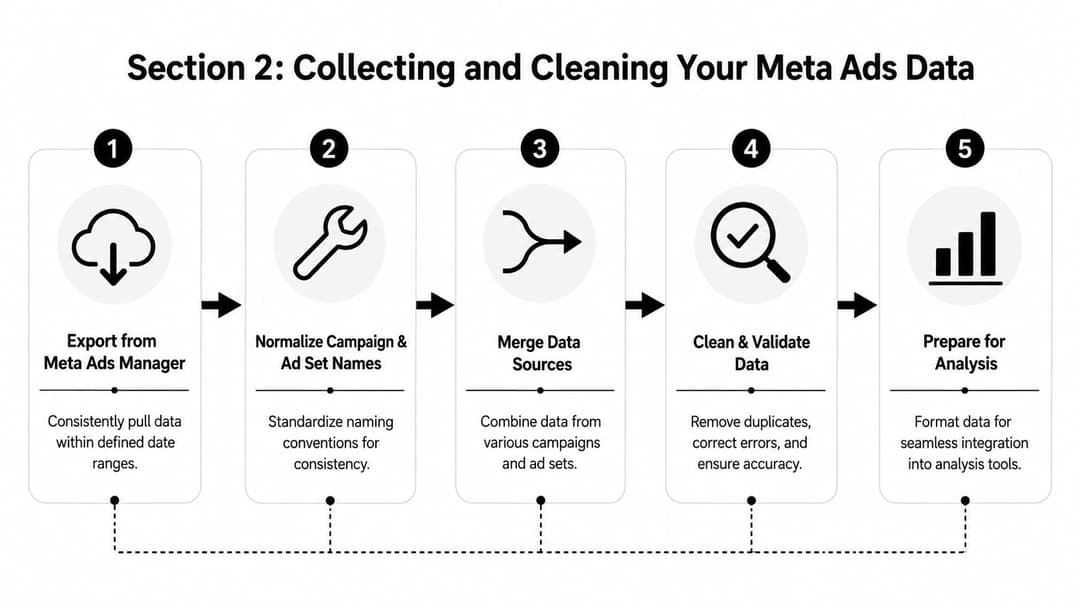
Bad analysis usually starts before the analysis even begins. Someone exports the wrong date range, names campaigns three different ways across three launches, and then wonders why the weekly report doesn't reconcile with Shopify or the CRM.
Start with a repeatable export habit
Pull Meta Ads Manager data with the same date logic every time. If one report covers a full week and the next cuts off midweek, timing drift will look like performance change. Keep campaign, ad set, and ad naming conventions stable across launches so the later cuts still mean something.
UTMs need the same discipline. Standardize source, medium, campaign, content, and term values so downstream reporting does not split one campaign into five slightly different versions. That matters even more once you start reconciling Meta-reported conversions against CRM or commerce events.
Practical rule: if a field can be typed inconsistently, it eventually will be typed inconsistently.
Clean the tracking breaks before you trust the numbers
The common failures are boring, and that is exactly why they keep happening. Pixels can fire twice, time zones can mismatch between systems, and event deduplication can make one platform look more complete than it is. iOS-related underreporting adds another layer of friction, so platform-native reporting should never be treated as the full truth on its own.
The cleanest process is to validate platform events against downstream data before you build the dashboard. Reconcile Meta with CRM or commerce records, check whether events land once, and confirm that date ranges line up across systems. Serious measurement starts when all sources are compared on the same basis, not when the platform report looks tidy.
A more durable setup is to centralize this pipeline instead of rebuilding it every Monday. If your team is already comparing Meta data against downstream systems, Meta Conversions API guidance is worth using as the technical reference point.
Running Segment and Cohort Cuts That Reveal Something
Once the data is clean, the next mistake is to stare at blended averages. A single ROAS line can hide one creative that's carrying the account, one audience that's burned out, and one placement that's steadily getting more expensive for worse results.
The cuts that actually explain performance
Creative cuts tell you whether the ad itself is decaying. If one concept keeps its click quality while another loses it, the fix is usually creative refresh, not a budget shuffle. If every ad in the set weakens together, that points more toward audience fatigue or a broader offer problem.
Audience cuts show saturation and overlap. A healthy audience segment usually keeps conversion quality stable while scale remains available. A broken one starts to climb in cost while returning fewer meaningful outcomes, which is often the first sign that the segment has been mined too hard.
Placement cuts are where Meta can hide inefficiency. A placement can look cheap on the surface and still produce worse downstream outcomes once you compare it to the rest of the account. Don't assume volume equals value just because the delivery system is spending there.
Device or platform cuts matter most when mobile behavior and reported outcomes diverge, especially in post-ATT environments. Device splits are less about finding a winner and more about spotting where signal quality has changed.
For cohort work, compare users acquired this week with users acquired last week, then follow the quality path instead of averaging them together. If one cohort holds value and another decays, you've learned something a blended ROAS number would've buried.
What each slice tells you next
| Cut | A healthy sign | A broken sign | Cheapest next move |
|---|---|---|---|
| Creative | One ad holds attention while others fade | Every ad weakens together | Refresh concept first |
| Audience | Conversion quality stays stable | CPA rises as delivery expands | Tighten or expand targeting |
| Placement | Spend maps to stronger outcomes | Cheap placement produces weak results | Rebalance delivery |
| Device | Mobile and desktop behave consistently | One device lags materially | Check signal and landing experience |
If you're deciding how much data is enough before making a call, sample size guidance for testing is a useful reference.
Attribution and Incrementality Without the Jargon
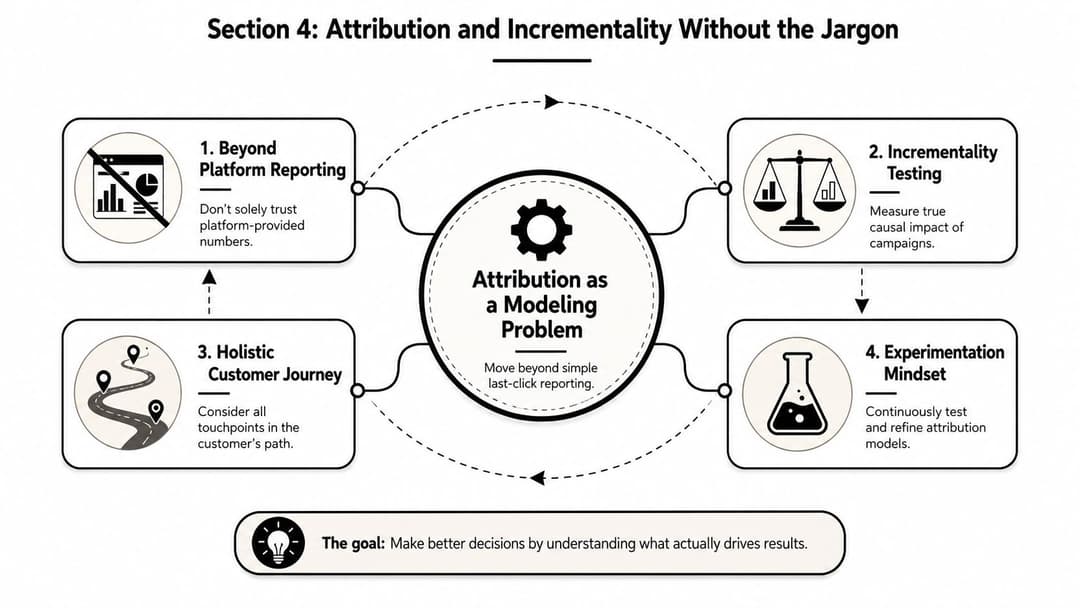
Attribution is a credit assignment model, not proof of causality. It helps explain which touchpoints got the conversion, but it does not prove the campaign created the outcome, and that gap matters when a Meta account is being evaluated against real budget.
Why one reporting model beats a moving target
Day-to-day analysis gets noisy when the attribution model changes from one report to the next. Use one model for routine comparison so the team is reading the same lens each week. That does not make the model perfect, but it does keep decisions consistent.
Attribution breaks down hardest when journeys are messy. Cross-device behavior, view-through influence, and dark social all make the platform look more certain than it should. Click-based attribution is still useful for routine comparison, but it is too narrow for high-stakes decisions.
Where incrementality earns its keep
Incrementality answers a different question. It asks whether the campaign caused extra conversions, not whether the platform got credit for them. Geo lift tests are the practical version of that idea, because they compare exposed and unexposed areas to estimate causal lift instead of leaning on correlation alone (WorkMagic on campaign performance analysis).
Practical rule: use attribution for weekly management, then use incrementality to audit the model that weekly management depends on.
The strongest workflow is not choosing attribution or incrementality. Use lift results to recalibrate the model that guides normal reporting, so the day-to-day view stays closer to contribution than coincidence. That keeps the dashboard useful without pretending it knows more than it does.
If you want a practical control-group lens for this kind of testing, control group testing guidance is the right companion piece.
Prioritizing the Action That Actually Moves the Number
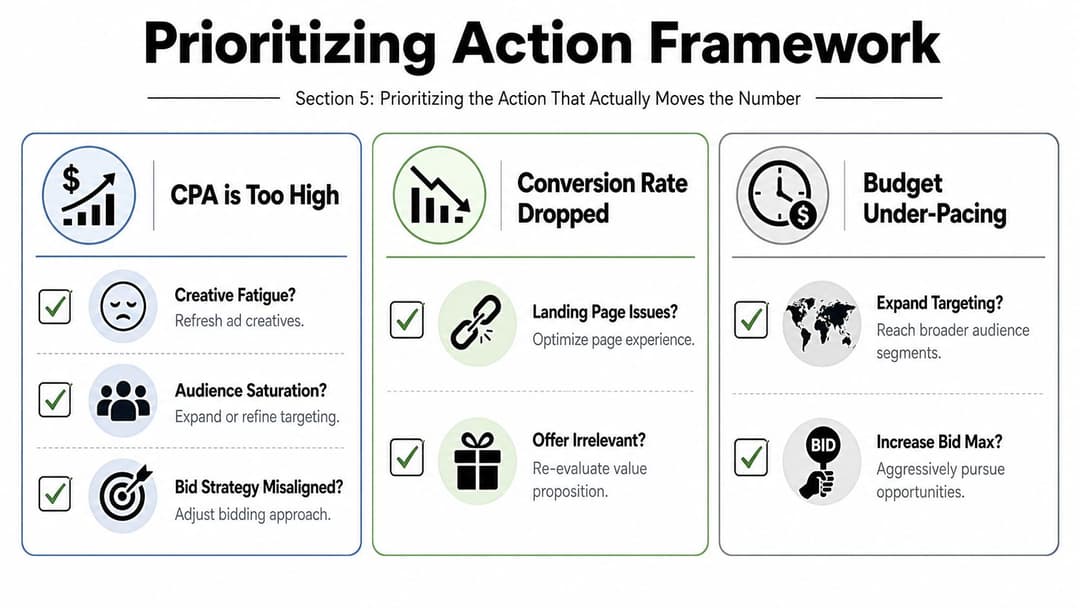
The value of analysis shows up in the first action you don't waste time on. A senior analyst doesn't just know what changed, they know what to check first, and what to leave alone until the evidence is better.
When CPA is too high
Start with creative fatigue. In real Meta accounts, tired creative is one of the most common reasons cost per outcome climbs, because the ad gets shown until people stop responding to it. If the creative is still fresh, then check audience saturation, especially when the same segment has been asked to absorb too much delivery.
If both of those look fine, move to bid strategy and landing-page friction. A misaligned bid can force the account into expensive auctions, while a weak landing page can turn decent click quality into poor outcome quality. Don't start by touching everything at once.
When CTR is dropping
Hook problems usually show up before anything else. If the opening frame, headline, or first line isn't pulling attention, CTR falls and everything downstream gets uglier. If hook quality is stable, check frequency and overlap before assuming the concept itself is dead.
Audience mismatch can also drag CTR down without changing the offer. That's why placement and audience cuts matter, because the same ad can behave very differently depending on where and to whom it's shown. The cheapest diagnostic is usually to compare the weakest ad set against the strongest one and isolate the first meaningful break.
When ROAS is healthy but scale is stalling
Sometimes the campaign is fine and the market is the limiter. Before declaring a ceiling, check pacing, budget constraints, and whether the account is being forced into a learning reset too often. If spend can't grow cleanly, the issue may be operational rather than strategic.
There are also plenty of cases where the right move is nothing. A stable campaign with acceptable cost per outcome doesn't need a tweak just because someone opened the dashboard and felt nervous. That's how good accounts get damaged by unnecessary changes.
Keep the review simple. Ask what changed, what's most likely, and what's cheapest to prove or disprove. If the answer doesn't point to one action, the analysis isn't finished yet.
Building Dashboards and a Repeatable Reporting Cadence
A useful reporting cadence needs three layers, and each one should answer a different question. Daily anomaly views catch broken tracking, pacing issues, and sudden creative collapse. Weekly performance views show which combinations are holding up. Monthly incrementality reviews tell you whether the account is creating lift or just recycling credit.
What belongs in each dashboard
The daily view should stay narrow. Pin the Meta Ads Manager breakdowns you check first, especially by creative, audience, and placement. If those slices are healthy, the rest of the account usually needs a closer look rather than a panic.
The weekly view is where ownership matters. One person should own media changes, one person should own tracking, and one person should own the decision log. The meeting should answer four questions in order, what changed, why, what we are doing about it, and who owns it by when.
The monthly view is where attribution gets challenged, not just accepted. That is the right place to compare platform-reported performance against broader business outcomes and any lift work you have run. A BI layer or visualization tool helps here, especially when Meta is one input in a multi-channel stack. It is also where a structured reporting process matters, because the teams that automate the routine with automated client reporting workflows spend less time formatting updates and more time checking whether Meta's credited results line up with what changed in the business. AdStellar AI is one option in that category, with historical Meta data ingestion and ranked insights across creatives, audiences, and messages, which fits naturally into a review process built around real performance rather than guesswork.
Practical rule: if a dashboard cannot tell you who owns the next move, it is a scorecard, not a management tool.
If you want a faster way to turn Meta data into decisions, AdStellar AI can help you rank creative, audience, and message performance from historical account data and organize the next round of testing around what is already working. Visit AdStellar AI to see how it can support a tighter campaign performance analysis workflow and reduce the time your team spends hunting for the next move.