Monday morning usually starts the same way. Someone opens three ad platforms, exports a CRM sheet, tries to reconcile a few naming mismatches, then pastes screenshots into a deck that's already running late. By the time the report lands in the client inbox, the analyst is tired, the account lead is improvising explanations, and one odd-looking number can turn a routine update into a trust issue.
That's why automated client reporting isn't just a prettier way to send the same deck faster. In practice, it's a governed measurement process built on recurring data refreshes, template population, per-client parameterization, and scheduled delivery, so the output is rebuilt from live sources without manual re-entry each cycle, then delivered as a slide deck, document, PDF, or interactive link (Rollstack's client reporting automation guide). That distinction matters when you're comparing ROAS, CPL, CPA, or channel mix across multiple accounts, because the framework has to stay reusable without losing account-specific context.
A lot of teams first look at the time savings and stop there. The better lens is risk. Manual reporting burns analyst hours, crowds out strategy work, and creates a fragile handoff where one copy-paste error can undo a month of clean execution. For agencies that want a practical starting point for broader reporting workflows, automated reporting for agencies is a useful companion read, and the operational pressure behind that advice shows up even faster when reporting is tied to campaign build speed, like in manual campaign building too slow.
The agencies that get this right stop treating reporting as a formatting task and start treating it like a recurring control surface. Once you do that, the whole conversation changes. You're no longer asking how to make a deck faster. You're asking how to make sure every number survives client scrutiny.
The Real Cost of Manual Client Reports
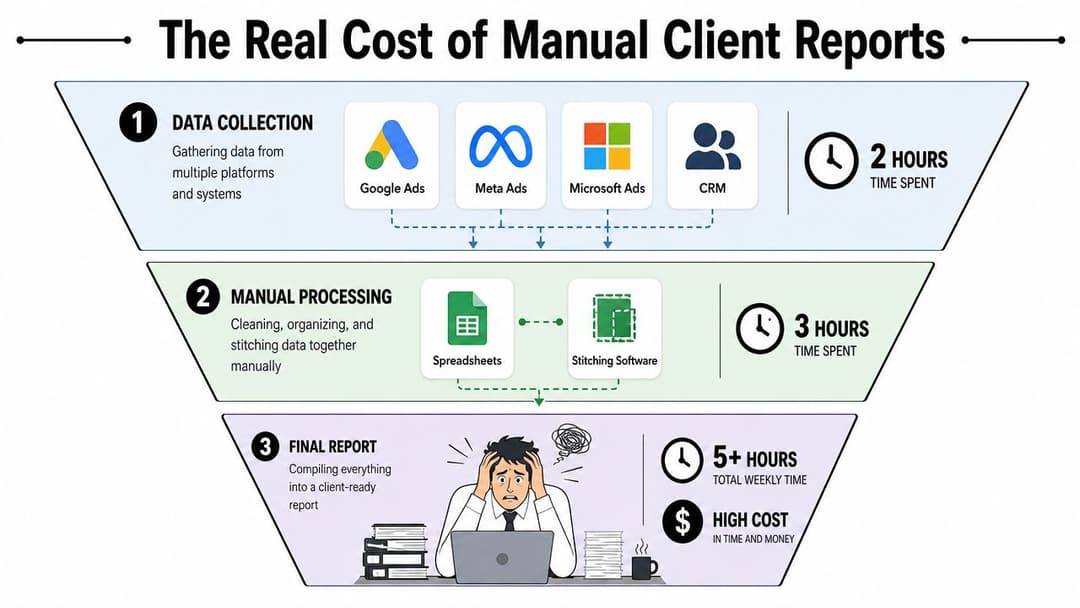
A mid-sized agency can lose half a day or more every week to a report that never feels finished. The analyst pulls paid media data, the strategist checks CRM outcomes, someone else hunts for a missing date range, and the account manager rewrites commentary so it sounds like the client's business instead of the platform's default language. By the end, the deck looks polished, but the process underneath it is brittle.
That brittleness creates three kinds of cost. First is labor cost, because every recurring report repeats the same collection, cleanup, and formatting work. Second is opportunity cost, because those hours don't go into testing, troubleshooting, or account strategy. Third is trust cost, because the moment a client sees a number that doesn't match their dashboard, they stop thinking about the report and start questioning the system behind it.
Why the hidden work never stays hidden
Manual reporting also makes operational quality uneven. One account gets a well-written narrative, another gets a rushed export, and a third gets a deck assembled by whoever had time that week. That inconsistency matters more than teams admit, because clients don't just judge the insights, they judge whether the agency seems in control.
The better comparison is not “manual versus automated” in the abstract. It's whether recurring reporting is being handled as a repeatable measurement workflow or a one-off production job. The first model scales cleanly. The second model eats senior time and turns every client review into a fresh recovery effort.
For a lot of agencies, the wake-up call comes when a report arrives two days late and the client already saw a different total in their own platform. At that point, the problem isn't speed. It's governance.
Practical rule: if the reporting process can't explain a discrepancy without someone digging through three spreadsheets, it's not ready for clients.
That's why this topic sits so close to operations, not design. A report that's late, inconsistent, or hard to reconcile creates more work than it removes. A report that's automated well becomes a stable artifact the whole account team can rely on.
Define Goals and KPIs That Survive the Five-Second Test
If the KPI layer is wrong, automation just makes the mistake harder to spot. A client who cares about ROAS and pipeline value will not tolerate a report that keeps spotlighting vanity totals, even if the data pipeline itself is clean. The metric definitions have to be settled before template design or delivery rules matter.
Start with a metric definition audit
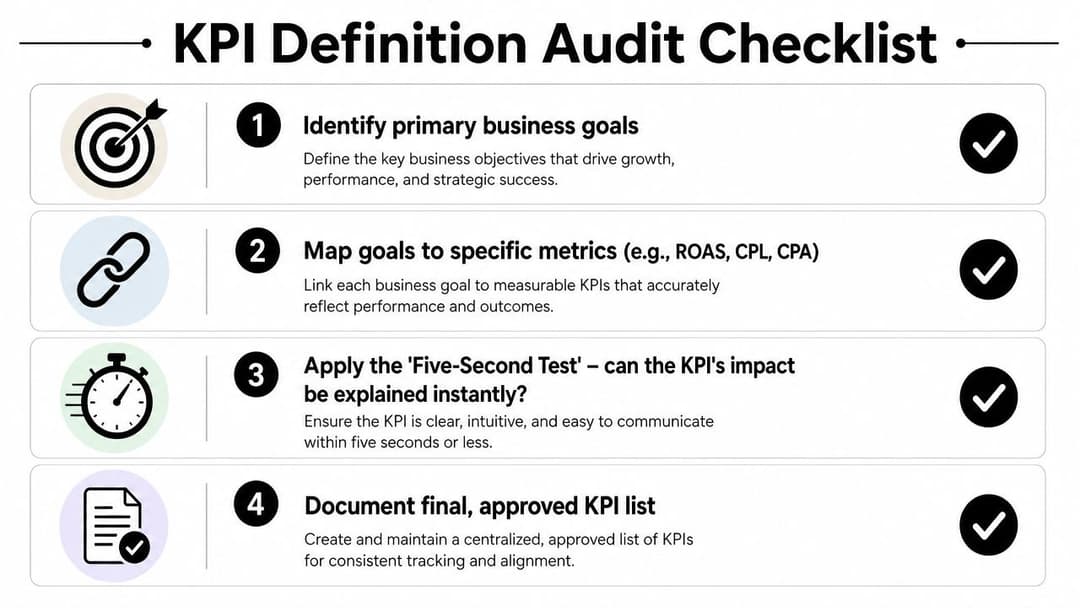
The practical move is to write down the client's business goal, then map it to a metric dictionary that both the account team and the technical builder can use without guessing. A performance marketer may need ROAS, CPL, CPA, and channel mix. A B2B lead gen client may care more about conversion volume and downstream pipeline. If the team cannot agree on what each metric means, automation will only reproduce the confusion faster.
The executive layer should stay small. Most reports work better with 3–4 core KPIs, so the client can scan the top of the report and know quickly whether performance is up or down (LLMRefs on automated reporting for clients). That is the point of the five-second test. If a CMO cannot glance at the top line and read direction immediately, the report is carrying the wrong level of detail.
A useful KPI dictionary does more than name metrics. It defines source, calculation, date logic, and who owns the final sign-off.
A good audit also checks for metric drift. I have seen teams agree on “lead” in a kickoff meeting, then discover later that sales, media, and analytics were counting different records. Once that happens, the automation is doing exactly what it was asked to do, and still failing the client. The fix is to document each KPI in plain language, attach the source of truth, and set a single owner for approval.
Match the layer to the stakeholder
Different readers need different depths. A CMO usually wants trend plus narrative, not a wall of channel detail. A performance lead wants the channel breakdown and anomaly context. A finance partner wants spend, efficiency, and payback framing. The report does not need a separate universe for each person, but it does need parameterized views so the same system can serve them without hand-built variants.
That is why a metric audit should happen before any tool decision. The report can only be automated cleanly if every KPI is already agreed, named, and prioritized. For a practical companion to this scoping work, campaign performance metrics is a useful reference point.
The cleaner the KPI dictionary, the less customization churn you will face later. Most “can you just add one more thing?” requests are really signals that the metric layer was never finished.
Design Reusable Templates With Per Client Parameters
Template design is where a lot of agencies accidentally build themselves into a corner. They start with one polished deck for one client, then clone it account by account until every new report is a fresh maintenance problem. The better approach is a modular report system built from reusable blocks that can be parameterized by account.
Build blocks, not bespoke decks
A scalable template usually has the same core pieces, but not the same hard-coded content. Think cover, executive summary, channel performance, creative performance, anomalies, and next steps. Each block should accept client-specific inputs like brand colors, logo, currency, thresholds, and narrative text. If client names or logos are hard-wired into the design file, reuse falls apart immediately.
The design win is that one data layer can power multiple outputs. The same core structure might generate a slide deck for a meeting, a PDF for archive, and an interactive link for live review. The data stays consistent, while the presentation adapts to the audience and delivery context.
| Report Block | Primary Audience | Detail Level |
|---|---|---|
| Cover and executive summary | CMO, founder, client lead | High-level |
| Channel performance | Performance manager, paid media lead | Mid-level |
| Creative performance | Media buyer, growth team | Operational |
| Anomalies and next steps | Account team, client stakeholder | Action-focused |
Keep the template flexible without letting it sprawl
The trap isn't just overdesign. It's also overcustomization. Once a template supports every request from every account, no two reports stay aligned long enough to compare cleanly. I've seen teams spend more time maintaining the template logic than they ever saved on production.
Practical rule: if a block doesn't help a stakeholder make a decision, it doesn't belong in the executive view.
Reusable templates work because they separate structure from instance. The structure stays fixed, the instance changes. That's the difference between a reporting system and a pile of branded documents.
Map Data Sources and Build the Automation Pipeline
Most automated client reporting programs fail in the data layer, not the delivery layer. Teams connect the platforms first, then discover too late that the fields don't line up, the dates don't match, or the attribution logic is different across sources. If the pipeline isn't normalized, the report is automated in appearance only.
Connect sources in the right order
The common starting set is usually Google Analytics, Google Ads, Meta/Facebook Ads, CRM data, and CSV uploads, all feeding into one reporting layer through API-based connections (HubSpot's agency reporting tools roundup). The build order matters. Schema first, connectors second, transformations third, template population last. If you reverse that sequence, you end up patching errors inside the report instead of fixing them at the source.
The main normalization traps are predictable. Date ranges don't always align. Timezones shift event boundaries. Attribution windows differ by platform. Campaign naming is often inconsistent across teams or regions. Each of those issues can create a report that looks correct but isn't comparable.
Choose the architecture that fits the team
Some agencies are best served by a warehouse-plus-BI setup. Others do better with a native reporting platform that reduces operational overhead. A third group needs a tool designed for agency delivery rather than enterprise analytics. The right choice depends on whether the team needs live dashboards, scheduled client PDFs, or a mix of both.
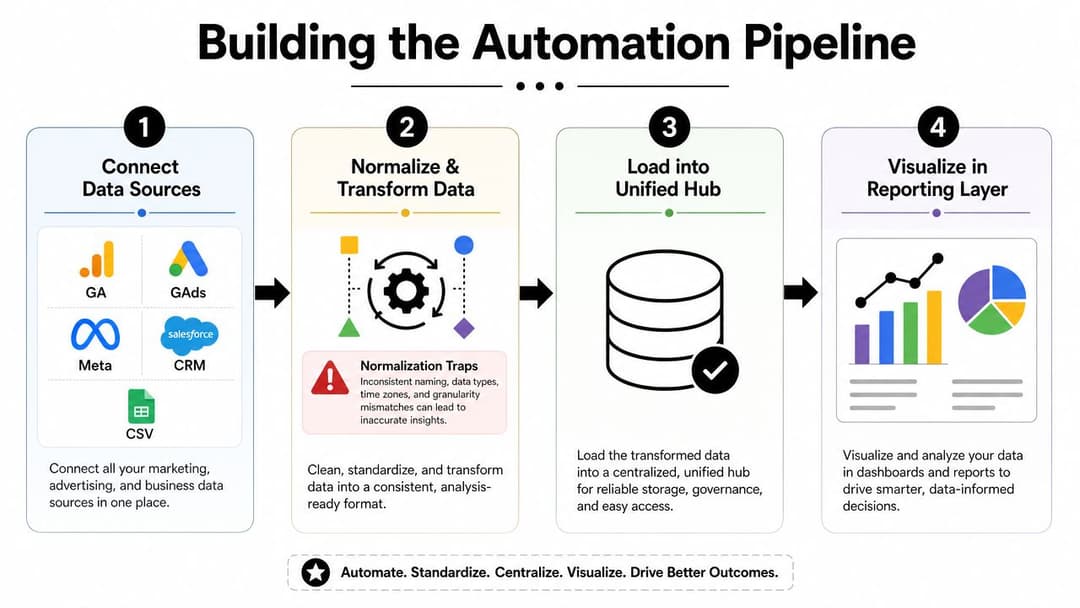
The most important thing is that the pipeline produces a single version of the truth before anything gets rendered for clients. That's why many teams pair source connections with a clear conversion and event capture layer, especially when ad platforms are feeding the same reporting system through gateways like conversion API gateway.
When the data model is clean, the report becomes predictable. When it isn't, every cycle turns into a reconciliation exercise.
Validate Against Manual Reports Before Clients See Anything
The first live test is simple. Run the automated report beside the manual version before a client ever sees it, because the system has to survive the first number that looks wrong. Trust comes from reconciliation, not from assuming the automation is right.
Run both systems side by side
Keep automated and manual reports running in parallel for 2–4 weeks, then compare each figure against platform source data before scheduled delivery is turned on (Automely's automated reporting validation guide). Any discrepancy above 5% deserves review during rollout, because that gap is large enough to signal a broken join, a filter mismatch, or a tracking issue that will surface later in front of a client. The point is not to hit a perfect score on day one. The point is to prove the automation can reproduce the manual baseline reliably enough to be trusted.
A reconciliation dashboard keeps that work visible. It gives the team one place to see what changed, where it changed, and which account owner needs to sign off on the fix. That ownership matters. If nobody is named, every mismatch turns into a debate instead of a correction.
Use a diagnostic flow, not guesswork
The fastest way to isolate a mismatch is to check the boring variables first. Date range. Timezone. Attribution window. Currency conversion. Filters. Once those are aligned, the remaining difference is usually easier to trace back to the source system or the report logic. For a deeper look at measurement rigor beyond attribution, see our guide to mobile app incrementality. That mindset carries into any validation process where the report needs to hold up under scrutiny, not just look polished on export.
The thresholding layer should also include anomaly detection. A movement of 20%+ week-on-week is a sensible trigger for a named reviewer during validation, because it catches spikes and drops before a client does. That does not mean every flagged change is wrong. It means every outlier needs an explanation before the report is released.
If an automated number differs from the manual baseline and the team can't explain why, the reporting system hasn't earned the right to run unattended.
There is a practical trade-off here. Slower rollout protects client trust, while rushing to full automation can turn one bad mapping into a recurring support problem. A governed validation step makes the system more durable, and it also shows the team where the process is still brittle, especially in high-volume workflows like automated Facebook ad reporting.
The mindset shift matters. Automation is a measurement process that needs gates, review, and rollback paths. If the first client-facing discrepancy cannot be explained and corrected, the problem is not the dashboard. The problem is that the reporting workflow was never validated enough to be trusted.
Schedule Delivery, Personalize per Client, and Add Exception Alerts
Once validation holds, delivery can be scheduled with confidence. Cadence stops being a guess and becomes part of the operating model. High-spend accounts often need daily reporting, most clients do well on a weekly rhythm, and executive summaries can sit on a monthly cadence because each audience needs a different pace and a different level of decision support.
Personalization is what keeps the report from feeling generic. The same template can work across accounts if client logo, currency, KPI thresholds, and narrative blocks are parameterized cleanly, so the team is not rebuilding the report every time the account changes. Format choices matter too. A PDF works for archives and forwarding. An interactive link is better for live inspection. A slide deck fits board meetings and live reviews.
The bigger shift is exception-driven reporting. The system should flag spikes in CPC, conversion drops, or overspend before the client asks why the number moved. That changes the workflow from passive distribution to active triage. It also gives the team a clear path to include a named reviewer, route the exception to the right owner, and record what was checked before the report goes out. For teams managing more than a few accounts, multi-account management in ad reporting becomes part of the control layer, not just an account list.
Choose the delivery mode by decision speed
A static report works when the goal is a recap. A live link makes sense when the client wants to inspect the data between meetings. Alerts are the right choice when the account moves fast enough that waiting for the next scheduled report would waste the intervention window.
The goal is fewer surprises and faster decisions. If every account gets the same cadence forever, the team will over-report to some clients and under-support others. Parameterized scheduling keeps that drift in check, and it gives the operations team room to set different thresholds, routing rules, and escalation paths without rebuilding the workflow each time.
Scale Automation Across Clients Without Breaking Trust
Scaling automated client reporting is not about onboarding more accounts faster. It is about proving that the same validation gate still holds when the next client uses different naming conventions, different stakeholders, and a different tolerance for detail. Agencies that scale well treat each new account like a controlled rollout, with clear checks before the report ever reaches a client inbox.
Pilot first, then graduate
A practical rollout starts with 3–5 clients for one full reporting cycle. That gives the team enough surface area to find the weak points without overwhelming operations. The failures usually show up in KPI scoping drift, inconsistent naming or date normalization, and turning on delivery automation before the data model is settled. If the pilot is messy, adding more accounts only spreads the same mistakes faster.
Graduation should be tied to a short checklist. The report matches source data. The stakeholder layer is correct. The anomaly logic behaves as expected. The reviewer owns sign-off. If any of those items are still unstable, the account stays in pilot.
Reuse the gate on every new account
As volume rises, the temptation is to cut corners to meet a deadline. That is usually where the system starts to break down. Each new client should pass through the same checklist, even when the template already exists and the team wants to move quickly.
- Confirm KPI scope: make sure the account is using the right executive metrics and not inheriting someone else's priorities.
- Verify source mapping: check that every connected platform is pulling the right property, ad account, or CRM source.
- Validate normalization rules: confirm date ranges, timezone settings, currency, and campaign naming.
- Assign account ownership: name the reviewer who signs off before delivery goes live.
- Test one full cycle: let the report run through a complete period before it becomes client-facing.
For teams managing multiple accounts at once, the broader operational lesson lines up with multi-account management. The reporting system only stays trustworthy if the same controls are reused as the client list grows, not relaxed because the workflow is already in place.
Automation scales when it stays governed. Once the team treats it as a formatting shortcut, it starts producing faster errors instead of faster clarity.