So, what exactly is a Facebook ad cost calculator? Think of it less like a simple spreadsheet and more like a strategic framework for mapping out your campaign costs and potential returns before you spend a single dollar. It’s the tool that helps you stop guessing and start building a data-backed forecast using core metrics like CPM, CPC, and conversion rates.
Why Guessing Your Ad Spend Is a Losing Game
Jumping into Meta advertising without a clear budget forecast is a surefire way to burn through cash and miss out on huge opportunities. Too many marketers fall into the trap of picking an arbitrary budget, hitting "launch," and just hoping for the best. This isn't a strategy—it's a gamble.

The real problem is that unpredictable spending leads to uncertain ROI. When you don't have a forecast, you have no baseline to know if your daily budget is too aggressive, too timid, or if your cost per lead is even sustainable for your business model.
The True Cost of Unpredictable Budgets
An unplanned approach to ad spend almost always ends in one of two ways. You either blow your budget way too fast on ads that aren't working, or you spend so cautiously that you never get enough data to figure out what does work. Either way, you're leaving money on the table.
When you advertise without a forecast, you're essentially flying blind. You might eventually reach your destination, but you’ll likely waste a lot of fuel and time along the way. A calculator acts as your flight plan.
Understanding the financial hit is crucial. We’ve seen countless advertisers who are shocked to learn just how much they might be losing money on Facebook ads simply from poor planning. The answer isn't just about spending less; it's about spending smarter.
From Guesswork to Strategic Forecasting
This is exactly where a Facebook ad cost calculator shines. It forces you to get serious about the metrics that actually matter to your bottom line. Instead of just chasing clicks, you start planning for customer acquisitions and, ultimately, revenue.
Building a simple calculator helps you:
- Set Realistic Goals: Finally understand what's truly achievable with your budget, using industry benchmarks and your own historical data as a guide.
- Identify Key Levers: See exactly how a small tweak to your click-through rate (CTR) or landing page conversion rate can dramatically lower your cost per acquisition (CPA).
- Justify Your Ad Spend: Walk into any meeting with a clear, data-driven case for your proposed budget and the results you expect to deliver.
By putting this kind of structure in place, you instantly gain clarity and control. You can anticipate costs, project your results, and make informed decisions that set your campaigns up for profitability from the very start.
Understanding The Core Metrics That Drive Ad Costs
To get a real handle on what your Facebook ads will cost, you need to think like Meta. Your ad spend isn't just a number you pick out of thin air; it’s the direct result of a few core metrics the platform uses to figure out how much to charge you. Getting these straight is the first, most important step in building any reliable forecast.
It all starts with two fundamental traffic metrics: CPM (Cost Per Mille) and CPC (Cost Per Click).
Think of CPM as the price of admission. It’s what you pay for every 1,000 times your ad is shown (an impression). This tells you the baseline cost just to get your ad in front of people.
From there, we have CPC, which is the price you pay whenever someone actually clicks your ad. This metric is tied directly to your CPM and your ad's Click-Through Rate (CTR)—the percentage of people who click after seeing it. A high CTR tells Meta your ad is relevant, and you're often rewarded with a lower CPC. A low CTR? You’ll pay more for each click because you're burning through impressions without getting engagement.
Moving Beyond Traffic to Business Goals
While getting clicks is great, it doesn't pay the bills. The metrics that really matter are the ones that measure how your ad spend translates into actual business results. This is where we shift our focus to CPA (Cost Per Acquisition) and CPL (Cost Per Lead).
For an e-commerce store, the holy grail is CPA. This is your average cost for a specific action—think a completed purchase, a new subscription, or an app install. If you're launching a new product, your CPA is the number that tells you if you're actually making money.
If you're in the business of generating leads—say, for a B2B service or a webinar—then CPL is your go-to metric. This is what it costs you, on average, to get a new lead through a form submission or a download. It’s how you know if your lead gen campaigns are cost-effective.
These action-based metrics are what connect your ad spend directly to business results. A low CPC is nice, but a low CPA or CPL is what actually grows your revenue.
For anyone serious about budgeting, a solid grasp of how the platform operates is non-negotiable. Digging into the specifics of Facebook Ads can give you a foundational understanding that makes this whole process easier.
We’ve put together a quick-reference table to help you keep these formulas straight.
Key Formulas For Your Facebook Ad Cost Calculator
Here's a quick look at the essential formulas you'll need to calculate and evaluate your ad performance and costs.
| Metric | Formula | What It Measures |
|---|---|---|
| CPM | (Total Ad Spend / Total Impressions) x 1,000 | The cost to show your ad to 1,000 people. |
| CPC | Total Ad Spend / Total Clicks | The average cost for a single click on your ad. |
| CTR | (Total Clicks / Total Impressions) x 100 | The percentage of people who click your ad after seeing it. |
| CPA | Total Ad Spend / Total Acquisitions | The cost to get one conversion (e.g., a sale). |
| CPL | Total Ad Spend / Total Leads | The cost to acquire one new lead. |
| ROAS | (Total Revenue from Ads / Total Ad Spend) x 100 | Your return on ad spend, expressed as a percentage. |
Having these formulas handy is one thing, but truly understanding how they work together is what separates a good forecast from a great one. For an even deeper dive into these and other critical KPIs, check out our complete guide on Meta ads performance metrics. The more accurate your assumptions are, the more realistic your budget will be.
How To Build Your Own Ad Cost Calculator
Sure, online tools are handy for a quick look, but if you really want to get under the hood of your ad spend, nothing beats building your own calculator. Creating a simple forecaster in Google Sheets or Excel gives you complete control and a much deeper feel for how all the numbers actually connect.
Let's move from theory to practice and build one right now. The first thing we need to do is establish your core inputs. Think of these as the control knobs you can twist and turn to see how they affect your potential results.
This whole process is about turning abstract metrics into a concrete plan. This flow chart breaks down how every dollar you spend is meant to move a potential customer through the funnel.
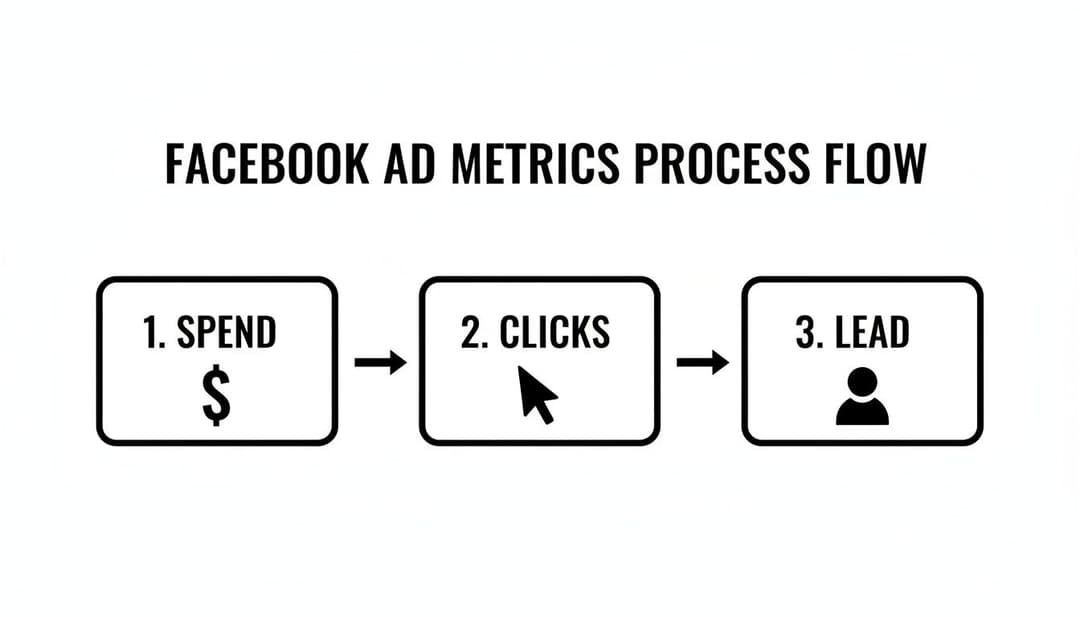
As you can see, it's a simple path: spend leads to clicks, and clicks hopefully lead to conversions. Your calculator will help you model just how that plays out.
Setting Up Your Inputs
In your spreadsheet, create a clean section at the top for your inputs. These are the assumptions you’ll be testing.
- Total Ad Budget: The total amount you're ready to invest (e.g., $5,000).
- Campaign Duration (Days): The number of days your campaign will be live.
- Estimated CPM: Your best guess for the Cost Per 1,000 Impressions. If you have past data, use it. If not, $12-$15 is a reasonable starting point for many industries.
- Estimated CTR: Your expected Click-Through Rate. It's wise to be conservative here; start with 1% if you're unsure.
- Landing Page Conversion Rate: The percentage of people who complete your desired action (buy a product, fill out a form, etc.) after clicking the ad. A typical rate falls between 2-3%.
- Average Order Value (AOV): For e-commerce, this is the average revenue you generate per sale.
Once you have these inputs plugged in, you're ready to build the formulas that will do the real work.
Building the Projection Formulas
Now, in a new section of your sheet, we’ll use formulas to automatically calculate your projected results. This is where the magic happens.
- Projected Impressions:
(Total Ad Budget / Estimated CPM) * 1000 - Projected Clicks:
Projected Impressions * Estimated CTR - Projected Conversions:
Projected Clicks * Landing Page Conversion Rate - Projected Revenue:
Projected Conversions * Average Order Value
With these formulas in place, you can add a few more to see the key performance indicators at a glance. This tells you the financial story of your forecast.
Pro Tip: I always recommend setting up "Best Case," "Realistic," and "Worst Case" scenarios. Just create three separate columns with different input values for each. This gives you a performance range and helps manage expectations with your team or clients.
Finally, we’ll calculate the core metrics that every marketer lives by. These formulas will pull directly from the inputs and projections you’ve already created.
- Cost Per Click (CPC):
Total Ad Budget / Projected Clicks - Cost Per Acquisition (CPA):
Total Ad Budget / Projected Conversions - Return on Ad Spend (ROAS):
Projected Revenue / Total Ad Budget
Suddenly, you have a dynamic model. You can instantly see how bumping your CTR from 1% to 1.5% on a $5,000 budget might slash your CPA and send your ROAS soaring. This hands-on approach demystifies ad spend, turning forecasting into a real strategic advantage.
If you want to get a better handle on that final, all-important return metric, you can learn more about how to calculate ROAS in our detailed guide.
Forecasting Realistic Business Outcomes With ROAS
Getting a handle on your costs is one thing, but that's just the start. The real magic happens when your cost calculator helps you predict actual business results, connecting every dollar you spend directly to your bottom line.
This is where Return on Ad Spend (ROAS) steps into the spotlight. It's the metric that shifts the conversation from "How much did we spend?" to "For every dollar we put in, how much did we get back?" Honestly, it's the ultimate measure of whether your campaigns are actually making you money.
The formula itself couldn't be simpler:
ROAS = Total Revenue from Ads / Total Ad Spend
Let's say you spend $1,000 on a campaign and it brings in $4,000 in sales. Your ROAS is 4x, or 400%. Simple. For every dollar you invested, you earned four dollars back.
What Is a Good ROAS?
Here's where it gets tricky. There's no single "good" ROAS that applies to everyone. The right number for you depends entirely on your profit margins, operating costs, and the very nature of your business. What’s a home run for one company could be a total disaster for another.
Think about it. A low-margin e-commerce brand selling t-shirts might need a 4x ROAS just to break even after accounting for the cost of the shirts, shipping, and all the other overhead.
On the other hand, a SaaS company with 80% margins or a high-ticket consultant could be absolutely thriving with a 2x ROAS. Why? Because each sale is almost pure profit.
Your target ROAS is your North Star metric. It defines the minimum performance required for your advertising to be profitable and sustainable. Without knowing this number, you’re still just guessing.
To really nail this down, it's helpful to understand how it fits into your broader marketing efforts. If you want to get a better handle on quantifying the financial success of all your marketing, learning about measuring content marketing ROI can provide some incredibly valuable context.
Planning for Performance Swings
The Facebook ad auction is a living, breathing thing. Performance is going to go up and down—that's a guarantee. A smart advertiser doesn't just hope for the best; they prepare for the swings. This is where your cost calculator becomes a powerful scenario-planning tool.
Instead of creating one rigid forecast, build out three different versions:
- Best-Case Scenario: What happens if everything goes right? Use optimistic—but still believable—numbers for your CTR and conversion rate. This shows you the campaign's absolute potential.
- Worst-Case Scenario: Now, let's be pessimistic. Plug in conservative numbers to see what the floor looks like. This helps you understand your risk and the minimum results you can expect.
- Realistic Scenario: This is your main forecast. Use your most likely estimates, pulled from your own historical data or solid industry benchmarks.
By creating this range, you can walk into any budget meeting with confidence. You’re not just presenting a single, fragile number; you're showing a full spectrum of potential outcomes. This approach prepares stakeholders for inevitable ups and downs and makes you look like the strategic pro you are.
This level of detailed planning turns your calculator from a simple number-cruncher into a genuine strategic asset. You can set defendable targets, justify your ad spend, and make decisions that are tied directly to your company's financial health. To learn more about how ROAS impacts your business, take a look at our complete guide on what ROAS is in digital marketing.
Common Mistakes That Inflate Your Ad Costs
A perfect forecast from a Facebook ad cost calculator is a great starting point, but it can't save you from a flawed campaign strategy. If you're making a few common, costly errors, your real-world ad spend will spiral, and those neat projections will become meaningless. Think of this as your pre-flight checklist to keep costs from getting out of control.

After managing countless campaigns, I've seen the same predictable—and fixable—mistakes pop up time and time again. Spotting them early is the key to protecting your budget and keeping your forecasts grounded in reality.
The first major culprit is ad fatigue. This is what happens when your audience sees the same ad over and over again. They get bored, stop engaging, and your relevance score tanks. In response, Meta’s algorithm starts charging you more to show your ad.
The Sneaky Cost-Driver: Ad Fatigue
The metric you need to obsess over here is Frequency. If you see it creeping past 3-4 for your cold audiences, that's a massive red flag. Your audience is getting tired of you, and your costs are about to spike.
Ad fatigue is the silent killer of profitable campaigns. Once users start ignoring your ad, the algorithm follows suit and penalizes you with higher costs. Staying ahead of it is non-negotiable.
The fix? Get proactive with a creative refresh schedule. Don't wait for your performance to dive off a cliff. Systematically introduce new ad copy, images, or videos to keep things fresh. Sometimes, all it takes is a new headline or a different background color to make an old ad feel new again.
Artificially Inflating Your Own Bids
Another mistake that quietly drains budgets is audience overlap. This happens when you run multiple ad sets that target similar or identical groups of people. You’re essentially forcing your own ad sets to bid against each other in the auction, which artificially drives up your costs.
To stop bidding against yourself, you need to get smarter with your targeting and exclusions. Here are a few ways to clean this up:
- Master Your Exclusions: When targeting a new lookalike audience, always exclude your existing customer lists and recent website visitors. This ensures you're only paying to reach genuinely new people.
- Consolidate Similar Ad Sets: Got a handful of small ad sets with nearly identical targeting? Merge them. This gives Meta's algorithm more data and breathing room to find the cheapest results for you.
- Run a Pre-Launch Check: Before you go live, use Meta's "Audience Overlap" tool. It will show you the exact percentage of users shared between two audiences, so you can fix the problem before you spend a dime.
Finally, picking the wrong campaign objective is like putting diesel in a gasoline engine—it’s just not going to work. If your goal is to get leads but you choose a "Traffic" objective, Meta will happily find you tons of cheap clicks, not conversions. You’ll end up with a high bounce rate and a terrible CPL. Always match your campaign objective directly to your business goal.
Using Historical Data For Smarter Forecasts
Industry benchmarks are a decent place to start, but let's be honest: they’re just educated guesses based on someone else's business. Any standard Facebook ad cost calculator that relies on generic CPMs or CTRs from unrelated industries is flawed from the get-go. Your audience is unique. Your creative is unique. Your data should be too.
This is where your own historical performance becomes your secret weapon. Instead of guessing what your CPM might be, you can look at what it actually has been. Pulling from your own past campaigns shifts your projections from hopeful theory to hard fact.
Tapping Into Your Ad Account Goldmine
Finding your own performance averages is simpler than it sounds. Just open your Meta Ads Manager and set the date range to the last 90 or 180 days. This gives you a solid sample size to work with. From there, customize your columns to show the core metrics we’ve been talking about.
You’re looking for a few key numbers:
- Average CPM: This is your true cost to reach 1,000 people, shaped by your specific audience, ad quality, and competition.
- Average CTR: This reveals how well your past ads actually captured attention and resonated with your market.
- Average CPC: This is your real-world cost per click, born from the interplay between your CPM and CTR.
Plugging these figures into your calculator will make your forecasts dramatically more accurate. For a complete walkthrough, our guide on Facebook ads historical data analysis breaks down the entire process. Suddenly, you're not just aiming for a 1% CTR; you're building your plan around the 1.7% CTR you know you’ve consistently hit.
From Static Spreadsheet to Dynamic System
Basing your forecast on past performance is a huge step up, but what if you could go deeper? Modern tools can do more than just calculate costs—they can analyze the why behind your best results. This is where a simple spreadsheet evolves into a dynamic forecasting engine.
When you feed your historical data into an AI system, you’re not just looking backward. You’re building a predictive model that gets smarter with every single dollar you spend.
Imagine a tool that doesn’t just use your average CTR. Instead, it sees that your video ads featuring user-generated content drove a 2.5% CTR with audiences interested in sustainable fashion. It can then recommend you double down on that exact recipe for your next campaign. This is the difference between simple forecasting and strategic campaign generation.
AI-powered analysis can uncover the hidden patterns by looking at your top-performing:
- Creative Elements: Pinpointing which images, videos, or ad formats consistently crush it.
- Audience Segments: Highlighting the specific lookalike or interest-based audiences that bring in the lowest CPA.
- Messaging Angles: Revealing which headlines and hooks truly connect with your customers.
This data-first approach closes the gap between planning and execution. It uses your own proven winners to build a more reliable cost forecast and suggest the campaign structure most likely to deliver. Your calculator stops being a static tool and becomes an active partner in your growth.
At AdStellar AI, we've built our platform on this exact principle. By connecting directly to your ad account, our AI analyzes your historical data to not only forecast costs but also to help you build and launch campaigns based on your top performers. See how it works at https://www.adstellar.ai.