In simple terms, Return on Ad Spend (ROAS) measures how much revenue your business generates for every single dollar you put into advertising. It’s the ultimate report card for your ad campaigns, telling you in no uncertain terms if your marketing dollars are actually making you money.
Understanding the Core of Ad Profitability

If you've ever felt like you're just throwing money at ads and hoping for the best, ROAS is the metric that cuts through the noise. It slices right past vanity metrics like clicks, impressions, and likes to answer the one question that truly matters: are my ads financially successful?
Think of it like a vending machine for your business. If you put $1 into the machine (your ad cost) and get a $4 snack out of it (your revenue), you have a 4:1 ROAS. This simple, powerful ratio is the bedrock of performance marketing, guiding budget decisions for everyone from e-commerce stores to B2B companies and agencies.
The Simple ROAS Formula
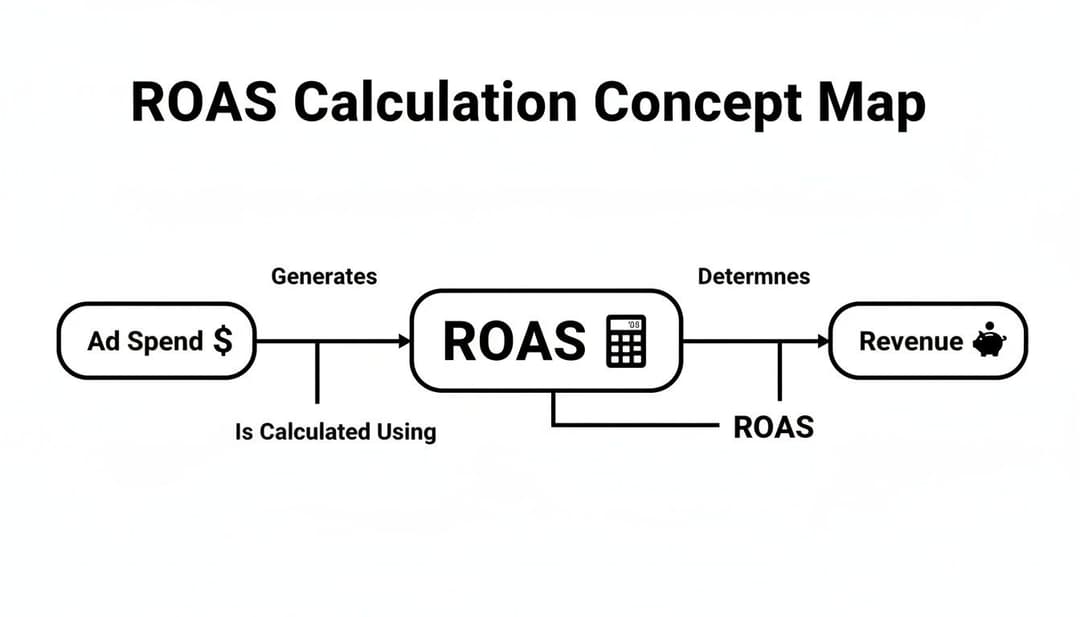
At its heart, the calculation is refreshingly straightforward. It draws a direct line from the money you spend on a campaign to the money it brings back in.
Let’s take a quick look at how ROAS is structured.
ROAS at a Glance
| Component | Description |
|---|---|
| Formula | Total Revenue from Ads / Total Ad Spend |
| Purpose | To measure the revenue generated for every dollar spent on advertising. |
| Benefit | Provides a clear view of ad campaign profitability and helps guide budget decisions. |
The formula itself is as clean as it gets:
ROAS = Total Revenue Generated from Ads / Total Ad Cost
So, for example, if you spend $2,000 on a Meta Ads campaign and it generates $8,000 in sales, your ROAS is 4. You can also think of it as 400%. This means for every single dollar you invested, you got four dollars back.
This clear, direct connection between spending and earning is precisely why performance marketers are so obsessed with it. You can see how this metric fits into the bigger picture in our guide to essential performance marketing metrics.
Why ROAS Is a Critical Metric
Understanding what ROAS is in digital marketing is the first step, but knowing why it matters is where the real power lies. This one metric empowers you to make smarter, data-driven decisions that directly boost your bottom line.
Here’s why it’s so indispensable:
- Identifies Profitability: It’s an immediate, crystal-clear signal of whether a campaign is actually profitable. A low ROAS is a red flag, warning you that a campaign needs a tune-up or should be paused entirely.
- Guides Budget Allocation: By comparing the ROAS of different campaigns, channels, or ad sets, you can confidently move your budget away from what’s not working and pour it into what is.
- Justifies Marketing Spend: When you need to prove the value of your work, ROAS is your best friend. It provides concrete data to show stakeholders that your advertising efforts are working, justifying your current budget and building a strong case for future increases.
- Separates Winners from Losers: It helps you quickly spot your highest-performing ads and audiences. This allows you to double down on your winners and stop wasting money on the duds.
Calculating ROAS With Real-World Scenarios
Theory is one thing, but seeing how the ROAS formula plays out in the real world is what makes the concept click. Let's walk through a few different business scenarios to see how this metric is used to measure success and inform what comes next.
The beauty of the ROAS formula is just how adaptable it is—it works for just about any industry or campaign goal you can think of.
Example 1: The Direct-to-Consumer Brand
Imagine a DTC company that sells high-end skincare. They decide to launch a Meta Ads campaign to push a new serum, putting $5,000 behind it for one month. At the end of the month, their analytics show the campaign directly drove $25,000 in sales for that serum.
It’s a straightforward calculation:
- Ad Spend: $5,000
- Revenue Generated: $25,000
- ROAS Calculation: $25,000 / $5,000 = 5
This gives them a 5:1 ROAS, or what marketers call a 5x return. For every single dollar they invested in those ads, they got five dollars back in revenue. This is a strong signal that everything—the ad creative, the audience targeting, and the product itself—is hitting the mark.
Example 2: The B2B SaaS Company
Now, let's switch gears to a B2B SaaS company with a project management tool. They run a $10,000 Google Ads campaign targeting professionals looking for productivity software. The campaign brings in 20 new customers, each signing up for a $150/month plan.
To keep things simple, the company measures ROAS based only on the first month's revenue from these new sign-ups.
- Ad Spend: $10,000
- Revenue Generated (First Month): 20 customers x $150 = $3,000
- ROAS Calculation: $3,000 / $10,000 = 0.3
A 0.3:1 ROAS looks pretty bad on the surface—they’re only making back 30 cents for every dollar they spend. But for a subscription business, that initial number doesn't tell the whole story. The real gold is in the customer lifetime value (LTV), which we'll dig into a bit later.
Example 3: The Marketing Agency
Finally, let’s look at an agency running a lead generation campaign for a local home renovation client. They spend $2,000 on ads, which generates 40 qualified leads. From experience, the client knows they close about 1 in every 4 leads, and each new project is worth $5,000.
To get to ROAS, the agency first needs to figure out the actual revenue those leads produced.
- Leads Converted to Sales: 40 leads / 4 = 10 closed deals
- Total Revenue Generated: 10 deals x $5,000 = $50,000
- ROAS Calculation: $50,000 / $2,000 = 25
The result is a massive 25:1 ROAS, showing the campaign was wildly profitable for the client. These examples just scratch the surface, and if you want to dive deeper, you can explore our complete guide on how to calculate ROAS for any type of business.
ROAS vs. ROI vs. CPA: Choosing The Right Metric For The Job
While ROAS is a fantastic metric for measuring the immediate effectiveness of an ad campaign, it doesn't tell the whole story. To get a true picture of your business's financial health, you need to understand how ROAS fits in with its close cousins, ROI and CPA.
Think of these metrics as different camera lenses. Each one gives you a unique perspective on your performance, and you need all of them to see what’s really going on.
ROAS is your zoom lens. It focuses tightly on one thing: the direct relationship between your ad spend and the revenue it brings in. It’s built to answer a very specific question: "For every dollar I put into this ad campaign, how many dollars did I get back?"
This direct line from ad spend to revenue is what makes ROAS so powerful for quick, tactical decisions.
As you can see, the calculation is refreshingly simple. It isolates just two variables: what you spent on ads and what you earned from them.
ROI: The Big-Picture View of Profitability
Return on Investment (ROI) is the wide-angle lens. It pulls back to show you the entire landscape of your business profitability, not just a single ad campaign.
The big difference here is that ROI accounts for all the costs associated with selling your product or service, not just the ad spend. This includes a whole host of other expenses:
- Cost of Goods Sold (COGS): What it actually costs to make what you sell.
- Overhead Costs: Things like rent, software, and salaries.
- Creative and Agency Fees: The money you pay to produce the ads or have someone manage them.
This is a critical distinction. A high ROAS can sometimes hide an ugly truth: you might not actually be profitable. We’ve seen campaigns with a seemingly great 4.2x ROAS that were still losing money once every single cost was factored in. In another case, a 2.13 ROAS was masking a razor-thin 6.7% profit margin.
CPA: The Cost of a Single Action
Finally, Cost Per Acquisition (CPA) is like a macro lens. It zeroes in on one tiny but crucial detail: how much you're paying to get a single customer. It completely ignores revenue. The formula is just Total Ad Spend / Number of Conversions.
A low CPA is usually a good sign—it means you're efficient at winning new customers. But a low CPA doesn't automatically mean your campaign is a success.
Imagine your CPA is $20, which sounds great. But what if those new customers only spend an average of $15 on their first purchase? You're actually losing money on every single acquisition, even with an "efficient" CPA. To learn more about this, check out our complete guide on what is cost per acquisition.
ROAS vs. ROI vs. CPA Compared
To make this crystal clear, here’s a quick breakdown of how these three essential metrics stack up against each other. Each one serves a different purpose, and knowing when to use which is key to making smarter marketing decisions.
| Metric | What It Measures | Formula | Best For |
|---|---|---|---|
| ROAS | The gross revenue generated for every dollar spent on advertising. | Revenue from Ads / Cost of Ads | Assessing the direct efficiency and revenue-generating power of ad campaigns. |
| ROI | The total profit generated from an investment after all costs. | (Net Profit / Total Investment) * 100 | Understanding the overall profitability of a marketing initiative or business. |
| CPA | The cost to acquire a single customer or conversion. | Total Ad Spend / Number of Conversions | Measuring the cost-efficiency of customer acquisition efforts. |
As you can see, they aren't interchangeable. They're complementary pieces of the same puzzle.
ROAS tells you how much you get back for what you spend. CPA tells you how much you spend to get one customer. ROI tells you if you actually made any profit after all expenses.
To make truly smart decisions, you need to look at these metrics together. A healthy ROAS is the first signal that a campaign is working. But it's ROI that confirms whether it's truly impacting your bottom line, while CPA helps you fine-tune the efficiency of how you get there.
What Is a Good ROAS? Benchmarks and Realistic Targets
Okay, so you’ve crunched the numbers and have your ROAS. The big question is, what now? Is your ROAS any good?
The honest answer: it depends. There’s no magic number that works for everyone. The single most important factor is your own business's profit margin.
A 4:1 ROAS is often thrown around as a decent benchmark. For every $1 you put into ads, you get $4 back in revenue. Sounds great, right? But that’s just revenue, not profit.
Profit Margins Are Everything
Your profit margin is the true north for your ROAS target. A business with fat margins can do just fine with a lower ROAS. On the other hand, a company with razor-thin margins needs a much higher return just to keep the lights on.
Let’s make this real with a couple of examples:
- The High-Margin Business: Imagine a SaaS company with a juicy 80% profit margin. For them, a 3:1 ROAS could be phenomenal. A huge chunk of that $3 in revenue is pure profit.
- The Low-Margin Business: Now think about an e-commerce store selling competitively priced products with a lean 20% profit margin. They might need an 8:1 or even 10:1 ROAS just to break even after paying for the products, shipping, and all the other costs.
A "good" ROAS isn't some arbitrary industry average. It's any number that gets you past your break-even point and pushes you toward your profit goals. It’s all about what your business needs to win.
This is why your first step is figuring out your break-even ROAS—the point where you're not making money, but you're not losing it either. The formula is simple: divide 1 by your profit margin.
For a business with a 25% margin, the break-even ROAS is 1 / 0.25 = 4. This means any ROAS above 4:1 is where the profit starts rolling in.
Industry and Channel Benchmarks
While your own numbers are what matter most, it's still smart to look at industry benchmarks. They give you a sense of what's possible and provide valuable context. These averages can swing wildly depending on the industry, the platform, and how ready your audience is to buy.
Generally speaking, a ROAS between 4:1 and 8:1 on Google Ads is considered pretty strong, which makes sense given the high-intent nature of search. In contrast, platforms like Meta (Facebook and Instagram) often have a lower average ROAS because people are there to scroll, not necessarily to shop.
Different sectors also see different returns. For B2B SaaS and agencies, pulling in a 2.30–3.1x ROAS from LinkedIn for generating enterprise leads is seen as a big win. This makes sense when you consider that 72% of marketing budgets are now aimed at digital channels, and 26% of marketers rank paid social as their #2 channel for ROI. If you want to dive deeper, you can check out more digital marketing statistics.
Ultimately, use benchmarks as a compass, not a map. Your target ROAS needs to be a custom number built from your own financials and business goals. That's how you build an advertising strategy that doesn't just look good on paper—it actually makes you money.
Proven Strategies to Improve Your ROAS
Knowing your ROAS is a great start, but the real magic happens when you start improving it. This is where you turn data into profit. Boosting your return on ad spend isn't about finding a single silver bullet; it's about making a series of smart, repeatable tweaks across your campaigns. The goal is to spend smarter, not just more.
By systematically refining who you target, what you show them, and what happens after they click, you can build a powerful engine for profitability.

Refine Your Audience and Keyword Targeting
The bedrock of a high ROAS is getting your ads in front of the right people. Wasted spend on audiences who couldn't care less is the fastest way to tank your returns. You want to zero in on users with the highest purchase intent.
Here are a few ways to sharpen your aim:
- Build Lookalike Audiences: Take your existing customer list and let platforms like Meta create "lookalike" audiences. This targets new people who share traits with your best customers, which is a much warmer introduction than starting from scratch.
- Leverage Negative Keywords: For search campaigns, treat your negative keyword list like a garden. Weed it constantly. This stops your ads from showing up for irrelevant searches that chew through your budget with zero chance of a sale.
- Implement Retargeting: Go after people who have already visited your site, added something to their cart, or engaged with your brand. These warm leads are often just one nudge away from buying and can deliver a much higher ROAS.
When you focus your budget on these high-potential groups, you make every dollar work harder for you.
Your ad is only as good as the audience that sees it. Stop showing ads to everyone and start showing them to someone who is likely to buy. This shift from a broad to a precise approach is a game-changer for ROAS.
Continuously Test Your Ad Creative
Your creative—the images, videos, headlines, and copy—is your sales pitch. Even tiny changes can have a massive impact on engagement and conversions, which directly feeds into your ROAS. The key is to stop guessing what works and start testing.
A/B testing is non-negotiable if you're serious about getting a better return. The trick is to test one variable at a time so you know exactly what’s making a difference. Need more ideas? We've got a whole guide on designing better digital marketing creatives.
Here are a few elements you should be testing all the time:
- Headlines: Try out different angles. Ask a question, state a clear benefit, or create a little urgency.
- Visuals: Pit a static image against a short video. Test different product shots to see which one stops the scroll.
- Call-to-Action (CTA): Don't just stick with "Shop Now." Experiment with different button text like "Learn More" or "Get Your Offer."
Once you find a winner, that becomes your new control. Then, you start testing something else against it. This cycle of continuous improvement is what separates the top-performing campaigns from the ones that just tread water.
Optimize the Post-Click Experience
Finally, a killer ad is only half the battle. If someone clicks your ad and lands on a slow, confusing, or totally irrelevant page, you’ve just paid for a click that has zero chance of converting. A smooth post-click experience is absolutely critical for squeezing every drop of revenue out of your ad spend.
Your landing page has to deliver on the promise your ad made. If your ad promotes a 20% discount on sneakers, the landing page better feature that offer and those sneakers, front and center.
Any friction in this journey—from slow load times to a clunky checkout process—will send users packing. That’s your ad spend going right down the drain, killing your ROAS. Make sure your landing pages are fast, mobile-friendly, and laser-focused on one single goal.
How AdStellar AI Can Supercharge Your ROAS

Let's be honest: trying to manually optimize for a higher ROAS is a grind. It's a slow, mistake-prone process that just doesn't work once you start scaling your campaigns. Juggling endless spreadsheets, A/B tests, and budget shifts across different platforms leaves almost no time for actual strategy.
This is exactly where automation tools like AdStellar AI come in to give your profitability a serious boost.
Instead of spending days just to build and test a handful of ad variations, AdStellar’s engine can test hundreds of creative and audience combinations at lightning speed. It moves past guesswork, learning what truly clicks with your most valuable customers to pinpoint the exact formulas that drive sales.
Unlocking Data-Driven Profitability
The platform’s AI Insights feature is designed to automatically identify and rank your best-performing ads against your specific ROAS targets. It brings the winning headlines, images, and audiences to the surface, giving you a clear roadmap for where to put your next dollar.
This creates a powerful feedback loop for your campaigns. The system continuously reinvests in proven strategies, helping you scale what works with far less manual effort. By taking over the tedious parts of campaign management, it frees up your team to focus on high-level strategy instead of getting buried in the details.
AdStellar turns reactive campaign adjustments into a proactive growth engine. It systematically pushes your ROAS higher by letting data—not assumptions—guide every single budget decision.
Ultimately, this approach helps you get a better return with more precision and speed than you could ever achieve manually. The entire system is built to turn creative chaos into campaign clarity, unlocking more revenue from your ad spend.
You can learn more about how AdStellar’s AI optimization features work to boost ad performance and drive sustainable growth for your business.
Got Questions About ROAS? We've Got Answers.
Even after you get the hang of ROAS, a few practical questions always seem to pop up when the rubber meets the road. Let's tackle some of the most common ones so you can navigate the real world of ad metrics with a bit more confidence.
How Long Should I Wait Before Measuring ROAS?
It’s incredibly tempting to check your ROAS the second a campaign goes live. I get it. But you have to resist the urge and give your attribution window time to work its magic.
This is the period where a conversion can still be credited back to your ad after someone clicks or sees it. A typical window is 7 days, so you’ll want to wait at least that long to get a clear picture. Pulling the plug too early might mean killing a campaign that was just about to find its groove.
Can I Have a High ROAS and Still Lose Money?
Absolutely. This is one of the most common (and painful) traps marketers fall into. It happens when you forget about one crucial piece of the puzzle: your profit margins. A high ROAS looks great on a dashboard, but it only tracks gross revenue against what you spent on ads—not your actual profitability.
Think about it: a 5:1 ROAS feels like a huge win. But if your profit margin is only 15%, you're actually in the red on every sale after you factor in the cost of your goods, shipping, and other operational expenses.
How Do I Calculate ROAS for Lead Generation?
This is a great question. When your campaigns are built to generate leads instead of direct sales, you have to do a little bit of homework to connect the dots. The trick is to assign a monetary value to each lead.
Start by figuring out your lead-to-customer conversion rate and the average lifetime value (LTV) of a new customer. From there, you can calculate an estimated revenue per lead. Once you have that number, you can plug it right into the standard ROAS formula and see the financial return on your lead gen efforts.
Ready to stop guessing and start scaling your ROAS with precision? AdStellar AI automates campaign creation, testing, and optimization to help you find winning ad combinations faster and reinvest in what's working. Learn how our platform can help you unlock more revenue from your Meta campaigns at https://www.adstellar.ai.