Performance marketing metrics are the numbers that tell you if your campaigns are actually working. Think of core stats like Return on Ad Spend (ROAS) and Cost Per Acquisition (CPA). These aren't just industry jargon; they're the data points that reveal exactly how much money you’re making for every dollar you put into your ads, letting you make smart, data-backed decisions.
Why Performance Marketing Metrics Are Your Compass

Ever tried flying a plane without any instruments? You might know which way is north, but you’d have zero clue about your altitude, speed, or how much fuel is left in the tank. That’s exactly what running a marketing campaign without clear metrics feels like. You’re flying blind, relying on hope.
Today, success isn’t just about buying ads; it’s about buying them intelligently. The days of "spray and pray" campaigns are long gone. We're in an era of precision, where every action can be measured and every result analyzed.
The Shift to a Data-Driven Mindset
Your campaign data is your cockpit. Each metric—your ROAS, your CPA, your click-through rate—is a vital gauge guiding your next move. These numbers tell you if you're on course to hit your goals, climbing steadily, or burning through fuel way too fast. Ignoring them is just guesswork, and in this market, guesswork is the fastest way to drain your ad spend.
Embracing this mindset is non-negotiable for anyone serious about digital advertising. When you let the metrics guide you, you unlock the ability to:
- Justify your budget with hard proof of what's driving results.
- Optimize campaigns on the fly by shifting money to your top performers.
- Spot the weak links in your funnel before they become a real problem.
- Scale what works with the confidence that comes from solid data.
Performance marketing turns advertising from a simple business expense into a predictable revenue engine. It’s the proof that your strategies aren't just creative—they’re profitable.
For a high-level view of how all your marketing efforts are paying off, mastering the Marketing Efficiency Ratio (MER) is a great next step. It gives you a consolidated look at your effectiveness across every dollar spent.
In this guide, we're going to break down the essential metrics you need to master, from foundational ones like ROAS and CPA to more strategic indicators like LTV. For a deeper dive into the numbers, check out our guide on https://www.adstellar.ai/blog/how-to-calculate-marketing-roi. We'll also explore how AdStellar AI can turn this raw data into automated campaign refinements, giving you the clarity needed to steer your growth with confidence.
The Four Essential Acquisition Metrics
If you're going to get anywhere with performance marketing, you have to get comfortable with the core metrics. These numbers are the lifeblood of any campaign, telling you in black and white whether you’re effectively bringing in new customers or just lighting money on fire.
Think of these as the four main gauges on your marketing dashboard. We’ll start with the big one—profitability—then drill down into what it costs to get leads and customers, and finally, check how well your ads are actually doing their job of grabbing attention.
First, let's create a quick cheat sheet you can reference anytime.
Key Acquisition Metrics At a Glance
Here’s a simple table that breaks down the most important acquisition metrics, their formulas, and what they actually tell you. Keep this handy as you build and analyze your campaigns.
| Metric | Formula | What It Measures |
|---|---|---|
| ROAS | (Revenue / Ad Spend) x 100% | The direct profitability and revenue return from your ad spend. |
| CPA | Total Ad Spend / # of Acquisitions | How much it costs to get one paying customer. |
| CPL | Total Ad Spend / # of New Leads | The cost to generate a single new lead for your business. |
| CTR | (Clicks / Impressions) x 100% | How compelling and relevant your ad is to its audience. |
Now, let's unpack what each of these really means for your campaigns.
Return on Ad Spend (ROAS)
Return on Ad Spend, or ROAS, is the king of profitability metrics. It cuts through all the vanity metrics like clicks and impressions to answer one simple, brutal question: "For every dollar I spent on ads, how many dollars did I get back?"
The formula couldn't be simpler:
ROAS = (Total Revenue from Ad Campaign / Total Ad Spend) x 100%
Let's say you sell handmade leather wallets online. You sink $1,000 into a Meta ad campaign for the month. At the end of the month, your analytics show that campaign drove $5,000 in sales.
Here's the math:
($5,000 Revenue / $1,000 Ad Spend) = 5
You'll often see this expressed as a 5:1 ratio or 500%. It means for every $1 you put in, you got $5 back. Instantly, you know the campaign is working. ROAS is a foundational metric, though savvy marketers are increasingly pairing it with longer-term indicators. The latest State of Performance Marketing report found that 75% of marketers are now looking beyond basic automation to focus on these kinds of data-driven outcomes. Discover more insights about these marketing metrics on agilitycms.com.
Cost Per Acquisition (CPA)
While ROAS is about profit, Cost Per Acquisition (CPA) is all about efficiency. It tells you exactly how much you have to spend to land one new paying customer. This is the cost of the final conversion—a sale, a new subscription, whatever your ultimate goal is.
Here’s the formula:
CPA = Total Ad Spend / Total Number of Acquisitions (or Conversions)
Imagine a shoe brand spends $2,000 on a Google Ads campaign and gets 100 new customers out of it.
Their CPA is:
$2,000 Ad Spend / 100 Customers = $20 per customer.
Knowing your CPA is absolutely critical. If your shoes sell for $80 and your profit margin is $40, a $20 CPA is great—you're making money. But if that margin is only $15, you’re losing $5 on every customer you acquire. Lowering your CPA is a direct lever for increasing profit.
Cost Per Lead (CPL)
Not every campaign is designed to make a sale on the spot. For businesses with a longer sales process—think SaaS or B2B services—the first goal is just to get a foot in the door. That's where Cost Per Lead (CPL) comes in. It measures how much it costs to get one person to raise their hand and show interest, like signing up for a webinar or downloading a guide.
The formula is almost the same as CPA, just focused on a different action:
CPL = Total Ad Spend / Total Number of New Leads
Let's say a SaaS company spends $3,000 on LinkedIn ads to promote a free webinar and gets 150 sign-ups.
Their CPL calculation is:
$3,000 Ad Spend / 150 Leads = $20 per lead.
CPL gives you a clear picture of your top-of-funnel costs. It’s a vital piece of the puzzle, and it works hand-in-hand with the total cost to acquire a customer. For a deeper dive, check out our guide on how customer acquisition cost is calculated.
Click-Through Rate (CTR)
Finally, we have Click-Through Rate (CTR). This metric is a direct reflection of how interesting your ad is. It measures the percentage of people who saw your ad (an impression) and were compelled enough to actually click on it. It’s your first signal that your creative and your audience targeting are aligned.
Here's how you calculate it:
CTR = (Total Clicks / Total Impressions) x 100%
If your ad was shown 10,000 times on social media and got 200 clicks, your CTR would be:
(200 Clicks / 10,000 Impressions) x 100 = 2%.
A low CTR is a red flag. It usually means your copy is falling flat, your visual is boring, or you’re simply talking to the wrong people. Improving your CTR is often step one in optimizing a campaign because more clicks create more opportunities to convert.
Matching Your Metrics to the Marketing Funel
Not all performance marketing metrics are created equal. Far from it. Their importance shifts dramatically as a potential customer moves from just hearing about you to actually buying something.
Trying to judge an awareness campaign by its direct sales is like asking a fish to climb a tree—you're using the wrong tool for the job, and you'll end up with the wrong conclusion. This is a classic mistake. I've seen countless marketers prematurely kill a promising top-of-funnel campaign simply because it wasn't driving immediate revenue.
To get a real sense of performance, you have to align your KPIs with the customer journey. This way, you're measuring the right signals at the right time, giving you a clear, honest picture of how each stage is working.
This diagram shows how the most critical acquisition metrics build on one another.
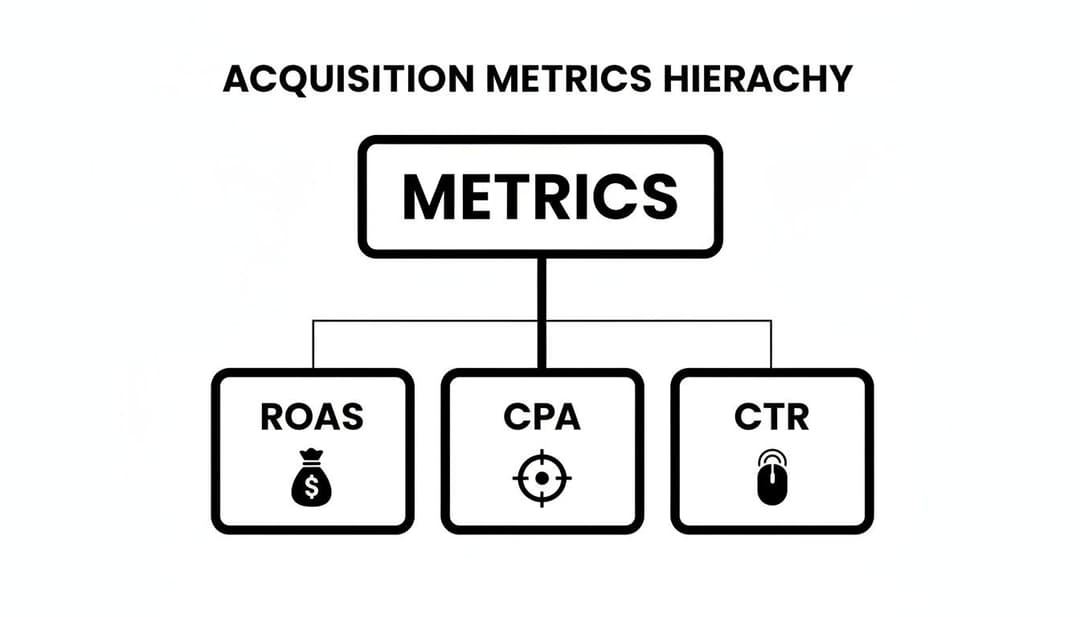
As you can see, bottom-of-funnel goals like ROAS and CPA are the ultimate prize, but they're built on a foundation of engagement, which starts with metrics like CTR.
Top of Funnel (ToFu): Awareness Metrics
At the top of the funnel, or ToFu, your only goal is to introduce your brand to people who've never heard of you. You're not asking for a sale yet; you're just saying hello. The focus is purely on reach and attention, not revenue.
Key metrics for this stage include:
- Cost Per Mille (CPM): This is what you pay for one thousand ad impressions. Think of it as your "eyeball efficiency" metric. A low CPM means you're reaching a ton of people without breaking the bank.
- Impressions: This one's simple: it's the total number of times your ad was shown. It's a fundamental yardstick for gauging the sheer scale of your awareness push. You can learn more about social media impressions in our deep-dive guide.
- Reach: The number of unique individuals who saw your ad. Unlike impressions, reach tells you how broad your audience truly is.
For a ToFu campaign, a high number of impressions at a low CPM is a huge win.
Middle of Funnel (MoFu): Consideration Metrics
Once someone knows you exist, the next job is to get them interested. The middle of the funnel (MoFu) is all about nurturing that initial spark into genuine engagement and consideration. You want to see if your message is compelling enough to get them to take a small step forward.
Your metrics now shift from exposure to interaction:
- Click-Through Rate (CTR): The percentage of people who not only saw your ad but actually clicked on it. A healthy CTR is a fantastic signal that your creative and messaging are hitting the mark with your audience.
- Cost Per Click (CPC): The price you pay every time someone clicks. Driving this number down means you're getting more traffic for your money—pure efficiency.
- Cost Per Lead (CPL): If you're running lead gen campaigns (like for a webinar signup or an ebook download), CPL tells you exactly what it costs to get a potential customer's contact info. This is an absolutely critical MoFu metric, especially for B2B marketers.
A high CTR and a low CPL in the middle funnel mean you’re successfully turning passive viewers into actively engaged prospects.
Bottom of Funnel (BoFu): Conversion Metrics
This is where the rubber meets the road. At the bottom of the funnel (BoFu), it's all about closing the deal. This is where your marketing efforts have to prove their worth in cold, hard cash. The metrics here are tied directly to revenue and profitability.
The bottom of the funnel is where performance marketing truly shines. Every metric at this stage should directly answer the question, "Did we make money?"
The most important BoFu metrics are:
- Conversion Rate (CVR): The percentage of clicks that result in the action you care about most, like a purchase. It's the ultimate test of how persuasive your landing page and offer really are.
- Cost Per Acquisition (CPA): This tells you the total cost to get one paying customer. For many, this is the single most important metric for measuring the efficiency of your customer acquisition engine.
- Return on Ad Spend (ROAS): The final verdict on profitability. ROAS calculates the total revenue you generated for every single dollar you spent on ads. It tells you, without a doubt, if your campaign was a financial success.
By zeroing in on CVR, CPA, and ROAS at this final stage, you ensure your campaigns aren't just generating clicks and buzz—they're actively driving business growth.
Measuring for Long-Term Profitable Growth
While metrics like ROAS and CPA are fantastic for checking the immediate pulse of a campaign, they only show a snapshot in time. Great marketing does more than just win a single sale; it builds a foundation for profitable, long-term growth. This means shifting your focus from the quick wins to the much bigger, more valuable picture of customer value.
This strategic perspective is built on two of the most critical metrics for any business that wants to scale: Customer Acquisition Cost (CAC) and Lifetime Value (LTV).
Understanding Customer Acquisition Cost
Customer Acquisition Cost (CAC) is exactly what it sounds like: the total sales and marketing cost required to land one new customer. It’s a much broader metric than CPA. Where CPA might track the cost per conversion for a specific ad, CAC bundles all your related costs—ad spend, agency fees, even your marketing team's salaries—over a given period.
The formula is pretty simple:
CAC = (Total Sales & Marketing Costs) / (Number of New Customers Acquired)
Knowing your CAC is the first real step to understanding whether your growth is actually making you money.
The Power of Lifetime Value
Lifetime Value (LTV)—sometimes called Customer Lifetime Value (CLV)—is a forecast of the total net profit you'll earn from a single customer over their entire relationship with your brand. It moves past that first purchase to account for repeat buys, subscriptions, and long-term loyalty.
This metric answers the most important question of all: "How much is this customer really worth to us?" For long-term success, looking beyond immediate gains to essential metrics such as understanding your Customer Lifetime Value is non-negotiable.
The Golden Ratio: LTV to CAC
Taken alone, CAC and LTV are interesting numbers. But when you put them together, they become a powerful strategic tool. The LTV:CAC ratio is one of the clearest indicators of your business's health and potential to scale.
A healthy LTV:CAC ratio is generally considered to be 3:1 or higher. This means for every dollar you invest to bring in a new customer, you get $3 back over their lifetime.
- A 1:1 ratio means you’re just breaking even on acquiring customers. That leaves zero room for profit or other business costs.
- A ratio below 1:1 is a red flag. You're actively losing money on every new customer you sign up.
- A ratio of 5:1 or higher is fantastic, and often a sign that you could be investing more in marketing to grow even faster.
Let’s use a real-world example. Imagine a subscription company called "SnackBox" has a CAC of $60. If their first box only generates $15 in profit, a campaign laser-focused on immediate ROAS would look like a total bust. To learn more about calculating immediate returns, you can read also our guide on ROAS.
But SnackBox knows their data. They know the average customer sticks around for 12 months, generating a total profit of $180. That makes their LTV $180.
Now, their LTV:CAC ratio is $180 : $60, which simplifies to 3:1.
Suddenly, that $60 acquisition cost isn’t just acceptable—it’s a smart, profitable investment fueling their long-term growth engine.
A Quick Word on Incrementality
Finally, as you analyze these high-level metrics, there's one more question you need to ask: are my ads actually causing these sales, or are they just taking credit for sales that would have happened anyway? This is the core concept of incrementality.
Incrementality measures the lift in conversions that would not have happened without a specific marketing touchpoint. It’s the ultimate proof that your ads are adding real value.
Think about it. A branded search ad will likely have low incrementality, as many people clicking it were probably already on their way to your site. On the other hand, a top-of-funnel prospecting campaign that introduces your brand to a completely new audience and drives a purchase? That's high incrementality. Proving that incremental lift is what separates good marketers from truly great ones.
How to Build a Powerful Marketing Dashboard

Let’s be honest: raw data is just noise. A spreadsheet overflowing with numbers from a dozen different platforms doesn't tell you a thing. In fact, it just creates confusion. The real magic happens when you transform that data into a clear, actionable story—and the best way to do that is with a well-structured performance marketing dashboard.
A powerful dashboard doesn’t just show you metrics; it organizes them in a way that actually guides decisions for different people on your team. It knows how to separate the high-level strategic view from the granular, in-the-weeds data needed for daily tweaks and optimizations.
Structuring Your Dashboard for Clarity
The most effective dashboards I've ever used are layered. They're built to cater to different audiences. Think of it as creating separate views for your CEO and your media buyer. Each one needs different information to do their job, and mixing it all together just creates chaos.
Here’s a simple, two-tiered structure you can adapt for tools like Google Data Studio (now Looker Studio) or Power BI:
- The Executive View (Strategic KPIs): This top layer is for leadership. It’s all about the big-picture business health and profitability. Keep it clean, visual, and focused on one question: "Is our marketing investment paying off?"
- The Practitioner View (Tactical Metrics): This is the granular, daily-use dashboard for media buyers and campaign managers. It’s built for real-time analysis and optimization, answering the question, "What can I do right now to improve performance?"
This layered approach prevents information overload and makes sure everyone is looking at the numbers that matter most to their role.
Key Metrics for Each Dashboard View
To make this practical, let's break down which metrics belong in each view.
1. The Executive Dashboard
This high-level report should focus on outcomes, not activities. It’s all about growth, efficiency, and the bottom line.
- LTV:CAC Ratio: The ultimate health metric. Is your growth sustainable?
- Overall ROAS: The total return from every dollar spent, blended across all channels.
- Total New Customers Acquired: The top-line growth number everyone cares about.
- Blended CPA: The average cost to get a customer across all marketing.
2. The Practitioner Dashboard
This is where your team lives day-to-day. It needs to be detailed enough to spot trends, diagnose problems, and jump on opportunities at the campaign, ad set, and creative level.
- Channel-Specific ROAS & CPA: Performance broken down by platform (e.g., Meta, Google).
- CTR & CPC by Creative: Identifies which ads are resonating and which are duds.
- Conversion Rate (CVR): Shows you how well your landing pages and offers are working.
- Spend vs. Budget Pacing: Keeps campaign spending on track and avoids surprises.
A classic reporting mistake is getting too obsessed with last-click attribution. It often undervalues the top-of-funnel channels that introduce new customers, tricking you into cutting budgets that are actually fueling future growth.
This focus on precise, outcome-driven metrics is why performance marketing now commands over half of all global marketing budgets. A recent report from MMA Global and Adobe found that 23% of marketers boosted their performance spend in the last year, shifting away from simple automation and toward strategies directly tied to business results. You can read the full report about the State of Performance Marketing on adobe.com.
Manually pulling all this data together is a huge time-sink and ripe for errors. This is where a platform like AdStellar AI really changes the game. It automatically centralizes your creative and audience data from Meta, presenting it in a clear dashboard that shows exactly what’s driving results—without any of the manual grunt work. For more on this, check out our guide on performance analytics for ads.
Turning Your Metrics into Action with AdStellar AI

Knowing your performance marketing metrics is one thing. But consistently using them to get better results? That’s a completely different ballgame. The reality for most of us involves endless hours digging through campaign data, trying to figure out which creative angle or audience segment is actually driving the best returns. This guesswork is slow and burns through your budget.
This is the gap where technology steps in—the space between knowing your numbers and making them work for you. Instead of drowning in spreadsheets, you can use AI to instantly connect performance data to campaign decisions, turning complex metrics into clear, automated moves for growth.
From Manual Analysis to Automated Optimization
Picture this: you’re trying to optimize hundreds of ad variations across dozens of audiences, all by hand. It’s impossible. You might find a few obvious winners, but you’ll definitely miss the subtle trends and end up scaling assets that only seem good on the surface.
AdStellar AI automates this entire headache. Our platform pulls in your real-time campaign data and uses its models to see how everything is performing against the goals you actually care about.
The whole point of AdStellar is to get rid of the guesswork. It doesn't just show you your CPA or ROAS; it tells you which specific creative and audience combinations are hitting those targets for you.
This flips your workflow on its head. You move from being reactive and manual to proactive and data-driven.
How AdStellar AI Powers a Smarter Workflow
Putting all the metrics we’ve talked about into practice suddenly becomes simple. The platform creates a cycle of rapid generation, smart testing, and automated scaling that turns your performance marketing metrics into real business growth.
Here’s the breakdown:
- Generate at Scale: Use AI to create hundreds of ad variations—headlines, images, and copy—in minutes, not days.
- Launch with Ease: Push all your test variations live to Meta with a single click, setting up a structured experiment without the tedious manual work.
- Identify Winners Automatically: AdStellar’s AI gets to work, analyzing the incoming performance data and ranking every creative and audience against your target metric, whether that's a lower CPA or a higher ROAS.
- Scale with Confidence: The platform highlights the proven winners. This gives you the confidence to move your budget to the ads and audiences that deliver the goods, maximizing your return.
This streamlined process doesn't just bump up your KPIs; it gives you back hours in your day. By letting AI handle the heavy lifting of data analysis, you can finally focus on high-level strategy instead of getting lost in the weeds. This is how you really turn data into dollars.
Got Questions About Performance Metrics? We've Got Answers.
Even after you've got the basics down, some of the finer points of performance marketing metrics can still trip you up. Let's tackle a few of the most common questions that pop up when marketers really start digging into their campaign data.
Is ROAS the Same Thing as ROI?
It's a classic mix-up, but no, they're not the same. While they both measure a "return," they operate on completely different scales.
Think of ROAS (Return on Ad Spend) as a microscope. It’s a tactical metric that looks at one specific thing: for every dollar you put into ads, how many dollars in revenue did you get directly back? On the other hand, ROI (Return on Investment) is the telescope. It's a broad, strategic metric that looks at the big picture of profitability. ROI takes into account your total investment—not just ad spend, but also your software costs, agency fees, creative production, and even team salaries.
In short, ROAS tells you if a specific ad campaign is making money. ROI tells you if your entire marketing engine is profitable.
How Do I Know What a "Good" Benchmark Is?
This is the million-dollar question, and the honest answer is: it depends. There’s no magic number for a "good" CPA or a universal standard for ROAS. It all comes back to your specific business, your industry, and most importantly, your profit margins.
A great starting point involves a few key steps:
- Do the Margin Math: First and foremost, your target CPA has to be less than your profit margin on a product. If it costs you $50 to acquire a customer for a product that only gives you $40 in profit, you're losing money on every sale.
- Look in the Mirror: Dig into your own historical data. What have your past campaigns delivered? This gives you a realistic baseline to work from, rather than chasing vanity metrics.
- Check the Neighborhood: Look up industry reports and studies. Knowing the typical CTR or CPL in your vertical can give you a sense of whether you're in the right ballpark.
Ultimately, a "good" metric is whatever keeps your LTV:CAC ratio healthy and profitable. If your customer lifetime value is sky-high, you can stomach a much higher customer acquisition cost upfront.
How Are Privacy Changes Affecting My Tracking?
The privacy wave, especially changes like Apple's iOS 14.5 update, has definitely made tracking a lot trickier. By giving users more control over who tracks them, it’s limited the amount of data platforms like Meta can slurp up.
This has a direct impact on the accuracy of your performance metrics. You're likely seeing fewer attributed conversions, which can make it look like your ads aren't working as well as they are. It’s become much harder to draw a straight line from an ad click to a final sale.
So, what's the fix? Marketers are adapting. There's a bigger focus on blended, big-picture metrics (like Marketing Efficiency Ratio, which looks at total revenue vs. total marketing spend). Many are also turning to solutions like server-side tracking to build a more complete and reliable data picture that doesn't just depend on the browser.
Stop guessing and start growing. AdStellar AI automates the analysis of your performance metrics, identifying the winning creatives and audiences that drive real results on Meta. Launch, test, and scale campaigns 10x faster.