Calculating your Return on Ad Spend (ROAS) is refreshingly simple. You just divide the total revenue your ads generated by the total amount you spent on them. The result is a straightforward ratio that tells you exactly how many dollars you're getting back for every dollar you put in.
Understanding ROAS and Why It Matters for Growth
For performance marketers, ROAS is the north star. Sure, metrics like impressions and clicks are part of the story, but ROAS gets right to the point. It answers the single most important question: "Are my ads actually making money?" It cuts through all the vanity metrics to give you a clear, unfiltered look at campaign profitability.
Think of ROAS as the pulse of your advertising. A high ROAS means you have healthy, profitable campaigns driving real business growth. A low ROAS is a warning sign—it’s time to rethink your strategy, creative, or targeting before you burn through more of your budget.
ROAS vs. Other Key Metrics
It's easy to get ROAS tangled up with other acronyms, but knowing the difference is crucial for making smart decisions.
- Return on Investment (ROI) is the big-picture metric. It measures the overall profitability of a business initiative, factoring in all costs—things like product manufacturing, shipping, salaries, and overhead.
- Cost Per Acquisition (CPA) tells you how much it costs to get one conversion, like a sale or a lead. The problem is, it doesn't care if that conversion was for $10 or $1,000, so it doesn't tell you anything about profitability.
ROAS zeroes in specifically on the effectiveness of your ad spend, making it the undisputed champion for optimizing ad campaigns. For a deeper look at the broader financial picture, you can learn more about how to achieve ROI in advertising.
What Is a Good ROAS?
There’s no magic number here. While a 4:1 ratio—that's $4 in revenue for every $1 spent—is often thrown around as a solid benchmark, the right target really depends on your business.
A business with juicy profit margins might be thrilled with a 3:1 ROAS. On the other hand, a company with razor-thin margins might need to hit an 8:1 ratio just to break even and start turning a real profit.
For a bit of perspective, the average ROAS across most industries sits around 2.87:1 as of 2024. That number has been squeezed by rising competition and major privacy shifts like Apple's ATT framework, showing just how tough it is to get strong returns these days. You can read more about the trends shaping ROAS benchmarks if you want to dig deeper.
Ultimately, your target ROAS shouldn't be based on an industry average. It needs to be tied directly to your unique profit margins and growth goals. That’s how you turn your ad budget from a line-item expense into a powerful engine for growth.
The Core Formula For Calculating ROAS
At its heart, the formula for ROAS is beautifully simple. It’s built to give you a quick, clear answer to the most important question in advertising: “For every dollar I put in, how many am I getting back?” Knowing how to calculate Return on Ad Spend is the first real step toward building profitable campaigns.
The fundamental calculation is just this:
ROAS = Total Revenue Generated from Ads / Total Cost of Ads
This formula cuts through the noise of vanity metrics and zeroes in on what actually matters—financial return. The result is usually shown as a ratio, like 4:1, or a multiple, like 4x. Either way, it means you earned $4 for every $1 you spent.
Breaking Down The Components
To get a number you can actually trust, you have to be brutally honest about what goes into each side of the equation.
- Total Revenue: This is the direct sales value your ad campaigns generated. Accurate attribution is non-negotiable here; you must be able to connect sales back to specific ads.
- Total Cost: This is where many marketers trip up. It’s more than just your ad spend. A true "fully-loaded" cost includes agency fees, software subscriptions for analytics or design tools, and even the cost of producing the creative itself.
This simple visual shows how that investment in ad spend directly fuels revenue, creating a virtuous cycle that powers business growth.
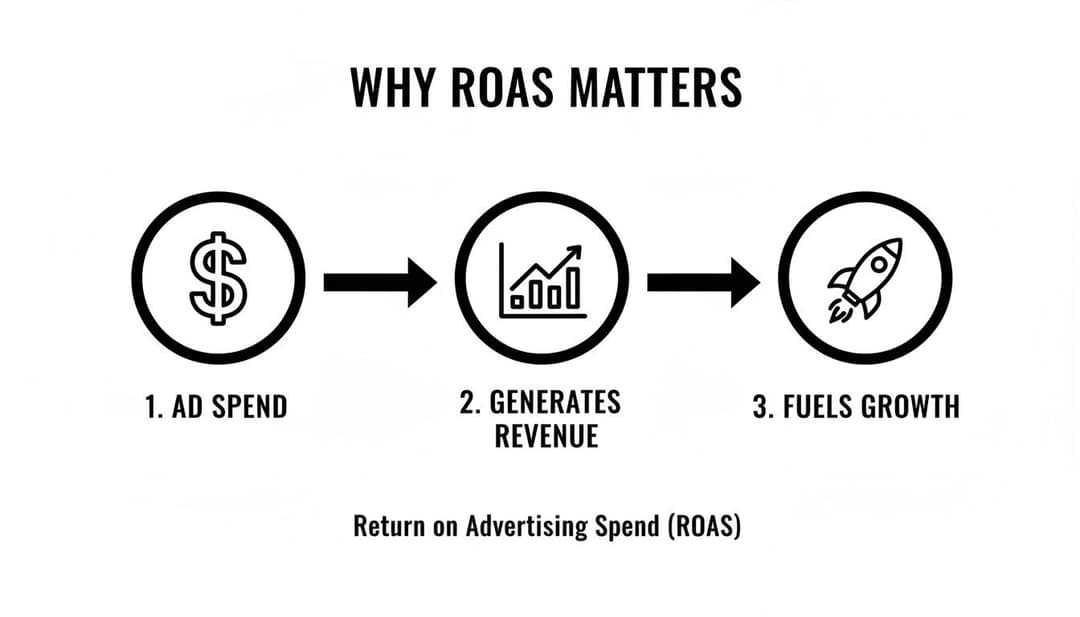
Think of it as a powerful loop: smart ad investments generate the cash flow needed to scale your marketing and grow the entire business.
ROAS Calculation Components At A Glance
To make this even clearer, here’s a quick breakdown of the core components you’ll need for your calculation.
| Component | Description | Example |
|---|---|---|
| Total Revenue | The total value of sales directly attributed to your advertising efforts. | $22,500 in product sales from a Google Ads campaign. |
| Total Cost | The complete "fully-loaded" cost of running the ads, including ad spend, agency fees, and software costs. | $5,000 in ad spend + $500 in agency fees = $5,500. |
| The Formula | Revenue divided by Cost. | $22,500 / $5,500 |
| The Result | The final ROAS, typically expressed as a ratio or a multiplier. | 4.09x or 4.09:1 |
This table serves as a handy reference, but the real magic happens when you apply it to your own numbers.
A Real-World ROAS Calculation Example
Let's walk through a common scenario. An e-commerce brand runs a Google Shopping campaign in 2024. They sink $5,000 into ad clicks over one month, and their analytics show $22,500 in product sales directly from that campaign.
Plug those numbers into the formula: $22,500 (Revenue) ÷ $5,000 (Cost).
The result is a 4.5 ROAS (or 4.5x). That’s a solid return that many performance marketers would be happy with.
Key Takeaway: Ignoring hidden costs like agency fees or creative production will artificially inflate your ROAS, giving you a dangerously misleading view of your campaign’s true profitability.
While ROAS is a killer metric for measuring campaign efficiency, it’s not the whole story for your business. For a broader perspective on overall profitability, check out our guide on how to calculate marketing ROI. Mastering this simple ROAS formula is the first step to making your ad budget work smarter, not just harder.
Putting Your ROAS Calculation Into Practice
Theory is great, but the rubber really meets the road when you start tracking your numbers consistently. You don't need some fancy, expensive software to get going. Honestly, a simple spreadsheet in Excel or Google Sheets is a powerful first step to get a daily pulse on your ROAS and see how your campaigns are actually doing.
Building your own tracking sheet is pretty straightforward. Just start with a few essential columns: Campaign Name, Ad Spend, Revenue, and of course, ROAS. This setup gives you a bird's-eye view, making it immediately obvious which campaigns are pulling their weight and which ones are just burning cash.
This simple layout in Google Sheets is a perfect example of how you can track multiple campaigns at once.
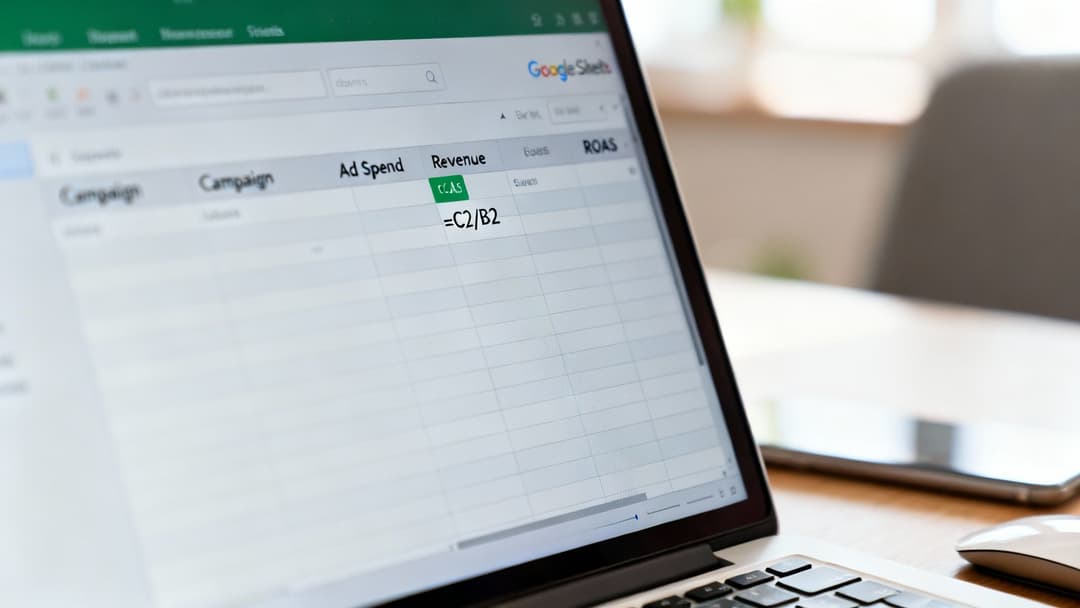
Once your revenue and ad spend data are plugged in, the formula takes care of the ROAS calculation automatically. It's an instant performance snapshot.
Setting Up Your Formula
Let’s get this set up. Imagine your Revenue is in column C and your Ad Spend is in column B. In the ROAS column (let's say, D2), you can pop in a simple formula to do the heavy lifting.
- In Google Sheets or Excel, type this into cell D2:
=C2/B2
This calculates the ROAS for the first campaign listed in row 2. Now for the magic trick: just click on cell D2, grab that little blue square in the bottom-right corner, and drag it down the column. The formula will instantly apply to all your other campaigns. Just like that, you have a living dashboard.
To get the most accurate revenue figures, solid tracking is non-negotiable. This usually starts with getting your tracking pixels installed correctly. Our guide on how to set up the Facebook Pixel is a fantastic resource if you're just starting out or just need a quick refresher.
From Manual Tracking to Automation
Let's be real—manually exporting data from all your ad platforms every single day gets old fast, especially as you start to scale. This is where dedicated reporting tools become a lifesaver. To really put your ROAS calculation into practice and handle more data without losing your mind, think about using specialized Google Ads reporting software tools. These platforms can automatically pull data from multiple sources, saving you a ton of time and cutting down on human error.
By starting with a simple spreadsheet, you build a rock-solid understanding of your core metrics. This hands-on experience makes it way easier to interpret the more advanced data you'll get from automated tools later on, ensuring you're always making decisions based on a genuine grasp of your campaign profitability.
Avoiding Common ROAS Measurement Mistakes
Calculating ROAS might feel like simple division, but getting a number you can actually trust is where many marketers stumble. And let's be honest, misleading data leads to terrible decisions—like killing a winning campaign just before it scales or, even worse, pouring money into a loser.
The most common pitfall? Relying solely on the numbers inside your ad platform.
The ROAS you see in your Meta Ads Manager, for example, is almost always inflated. It’s not malicious; it's just that these platforms are designed to take as much credit as possible for conversions. They often use generous attribution windows that can make a campaign look far more profitable than it really is. This creates a dangerous gap between what the platform reports and what your bank account actually shows.
The Attribution Model Trap
One of the biggest sources of error is the attribution model. A simple last-click model gives 100% of the credit to the final touchpoint a customer had before buying. It’s clean and easy to understand, but it’s often deeply misleading because it ignores all the other ads that warmed the customer up.
On the flip side, multi-touch attribution tries to distribute credit across the entire customer journey. This gives you a much more holistic view of what's working, but it can get complicated to set up and interpret. Understanding how different touchpoints contribute is essential. For instance, a view-through conversion—where someone sees your ad, doesn't click, but converts later—can have a huge impact. You can dive deeper into why that matters by learning about what a view-through conversion is and how it fits into the bigger picture.
Key Takeaway: Never treat the ROAS from your ad platform as gospel. Always cross-reference it with your own business data. Your Shopify dashboard or internal sales records are your source of truth.
Navigating Data Gaps and Tracking Limitations
Privacy changes have made accurate tracking harder than ever. Ever since Apple’s iOS 14 update, getting reliable data from mobile users has become a major headache for advertisers. This data loss means many conversions simply aren't tracked, which artificially tanks your reported ROAS.
And it’s not getting any easier. The slow death of third-party cookies means we’re all facing even bigger data gaps, making it tougher to connect the dots between ad spend and revenue. To fight back, smart marketers are adopting more robust tracking solutions.
- Server-Side Tagging: This method sends data directly from your server to platforms like Meta, bypassing the browser-level restrictions that block tracking. The result is far more accurate and reliable conversion data.
- Conversion APIs (CAPI): Platforms like Meta offer a CAPI that creates a direct pipeline between your marketing data and their systems. This helps fill in the gaps left by traditional browser-side pixels.
By understanding these common mistakes, you can move from relying on shaky platform metrics to building a measurement system that reflects true profitability. It’s this shift that allows you to make smarter, data-backed decisions that actually drive growth.
Actionable Strategies for Improving Your ROAS

Knowing how to calculate your ROAS is just the starting line. The real race is won by consistently making that number go up. Shifting your focus from just measuring to actively optimizing is where you’ll see meaningful growth and finally turn your ad spend into a powerful revenue engine.
So, let's dive into the core strategies that actually move the needle. These aren't complicated tricks; they're the fundamentals that always work when you execute them with precision. It all comes down to three key pillars: getting the right message in front of the right people and making their path to purchase as smooth as possible.
Refine Your Audience Targeting
You could have the most compelling ad in the world, but if it’s shown to the wrong audience, it’s just noise. Improving your ROAS starts with laser-focused targeting. It’s time to stop casting a wide net and start zeroing in on the users most likely to actually buy something.
This means going beyond basic demographics and digging into user behavior and intent.
- Build Lookalike Audiences: Take the data from your best existing customers and use it to find new people with similar characteristics. This is often one of the quickest ways to find high-converting prospects.
- Leverage Retargeting: Don’t let warm leads go cold. Create campaigns specifically for users who have visited your site, added items to their cart, or engaged with your content. Remind them why they were interested in the first place.
- Analyze Your Data: Get into your analytics and see which audience segments are already delivering the highest ROAS. Double down on what's working and ruthlessly cut spend from underperforming segments.
Elevate Your Ad Creative and Copy
Once you’ve honed in on your audience, your next job is to stop their scroll. Generic, uninspired creative gets ignored. Ads that resonate with your audience’s pain points and desires are what drive clicks and conversions.
This isn’t just about making things look pretty; it’s about clear communication. Test different formats—video, carousels, and high-quality images—to see what grabs their attention. Your copy should speak directly to your target customer, highlighting benefits over features and ending with a crystal-clear, compelling call-to-action (CTA).
Expert Tip: A/B testing is non-negotiable here. You have to continuously test different headlines, images, and CTAs. Small changes can lead to significant swings in performance, and you’ll never know what works best until you test it.
Optimize Your Landing Page Experience
Getting the click is only half the battle. If your landing page is slow, confusing, or doesn’t deliver on the promise of your ad, you’re just lighting money on fire. A seamless landing page experience is critical for turning those clicks into conversions.
Make sure your page loads lightning-fast—every extra second of load time dramatically increases bounce rates. The headline and content should directly match the ad that brought them there, creating a cohesive and reassuring experience. And most importantly, your CTA should be prominent and easy to find, guiding the user toward the exact action you want them to take.
Accelerate Your Wins with AI
Trying to manually manage all these variables—audiences, creatives, landing pages—is a massive undertaking. This is where AI-powered tools can be a total game-changer, turning guesswork into a data-driven system.
Platforms like AdStellar analyze your performance data to automatically identify which ad combinations are driving the best results. By pinpointing winning creatives and audiences faster than a human ever could, these tools let you scale your successes effectively and efficiently. This data-backed approach is essential for any modern marketing team. For a closer look at how this technology works, you can explore our guide on using AI for Facebook Ads.
Common Questions About ROAS (And Some Answers You Can Actually Use)
Once you move past the basic formula, you start running into those tricky real-world questions about ROAS. Knowing the calculation is one thing; knowing how to apply it and what it really means for your business is another game entirely.
Let’s dig into some of the most common questions that pop up on the path to profitability.
What's a Good ROAS for E-commerce?
You'll often hear 4:1 ($4 back for every $1 spent) thrown around as the gold standard for e-commerce. But honestly, that’s just a benchmark. The real answer depends entirely on your profit margins.
A business selling high-margin luxury goods might be printing money at a 3:1 ROAS. On the flip side, a store with razor-thin margins might need an 8:1 ROAS just to break even and see a decent return.
The most critical number you need to know is your break-even ROAS. Here’s the simple formula to figure it out:
Break-Even ROAS = 1 / Profit Margin
So, if your profit margin is 25% (or 0.25), your break-even ROAS is 1 / 0.25 = 4. This means you absolutely need a ROAS of 4:1 just to cover your costs. Anything above that is profit in your pocket.
How Is ROAS Different from ROI?
This one trips people up all the time, but the distinction is crucial. Both ROAS and ROI measure returns, but they operate at completely different levels.
- ROAS is a campaign-level metric. It’s hyper-focused on one thing: the direct effectiveness of your advertising spend. It compares ad cost to the revenue generated directly from those ads.
- ROI (Return on Investment) is the big-picture business metric. It measures the overall profitability of an entire initiative, factoring in all the associated costs—cost of goods sold, shipping, salaries, software, you name it.
Think of it this way: ROAS tells you if your ads are working. ROI tells you if your business is actually making money.
Can I Calculate ROAS for Lead Gen Campaigns?
Absolutely, you just need to add one extra step. Since leads don't come with an immediate price tag, you have to assign them a value based on what they're worth to your business down the line.
First, you need to know your lead-to-customer conversion rate and the average lifetime value (LTV) of a customer. For example, if you know that 1 in 20 leads eventually becomes a customer and your average LTV is $4,000, then you can say each lead is worth about $200 ($4,000 / 20).
From there, your ROAS formula just gets a slight tweak: (Number of Leads * $200) / Ad Cost.
Why Doesn't My Ad Platform ROAS Match My Own Numbers?
Welcome to one of the most common frustrations in digital marketing. The answer almost always boils down to one word: attribution.
Platforms like Meta and Google want to show you how great they are, so they often use generous attribution windows (like a 28-day click) and are quick to take credit for sales that other channels might have influenced.
Your own internal analytics, whether from your e-commerce platform or Google Analytics, likely uses a stricter model, such as last-click attribution. The best practice is to always treat your own business data as the single source of truth. Use the platform-reported ROAS as a directional guide for making optimizations inside the platform, but rely on your numbers for the final word on profitability.
Stop guessing which campaigns are truly profitable and start making data-backed decisions. AdStellar AI launches, tests, and scales your Meta campaigns by automatically identifying your top-performing creative and audience combinations. Cut through the noise and scale your ROAS with confidence. Find out how AdStellar AI can transform your ad performance.