If your Facebook Ads reports feel like a cluttered mess of metrics that don't really tell you anything, you're in good company. So many performance marketers are drowning in raw data but absolutely starving for real, actionable insights.
This guide is built on one simple idea: great fb ads reporting isn't about pulling numbers. It's about telling a story—a story that drives smart, strategic decisions for your business.
Why Your Current FB Ads Reporting Isn't Working
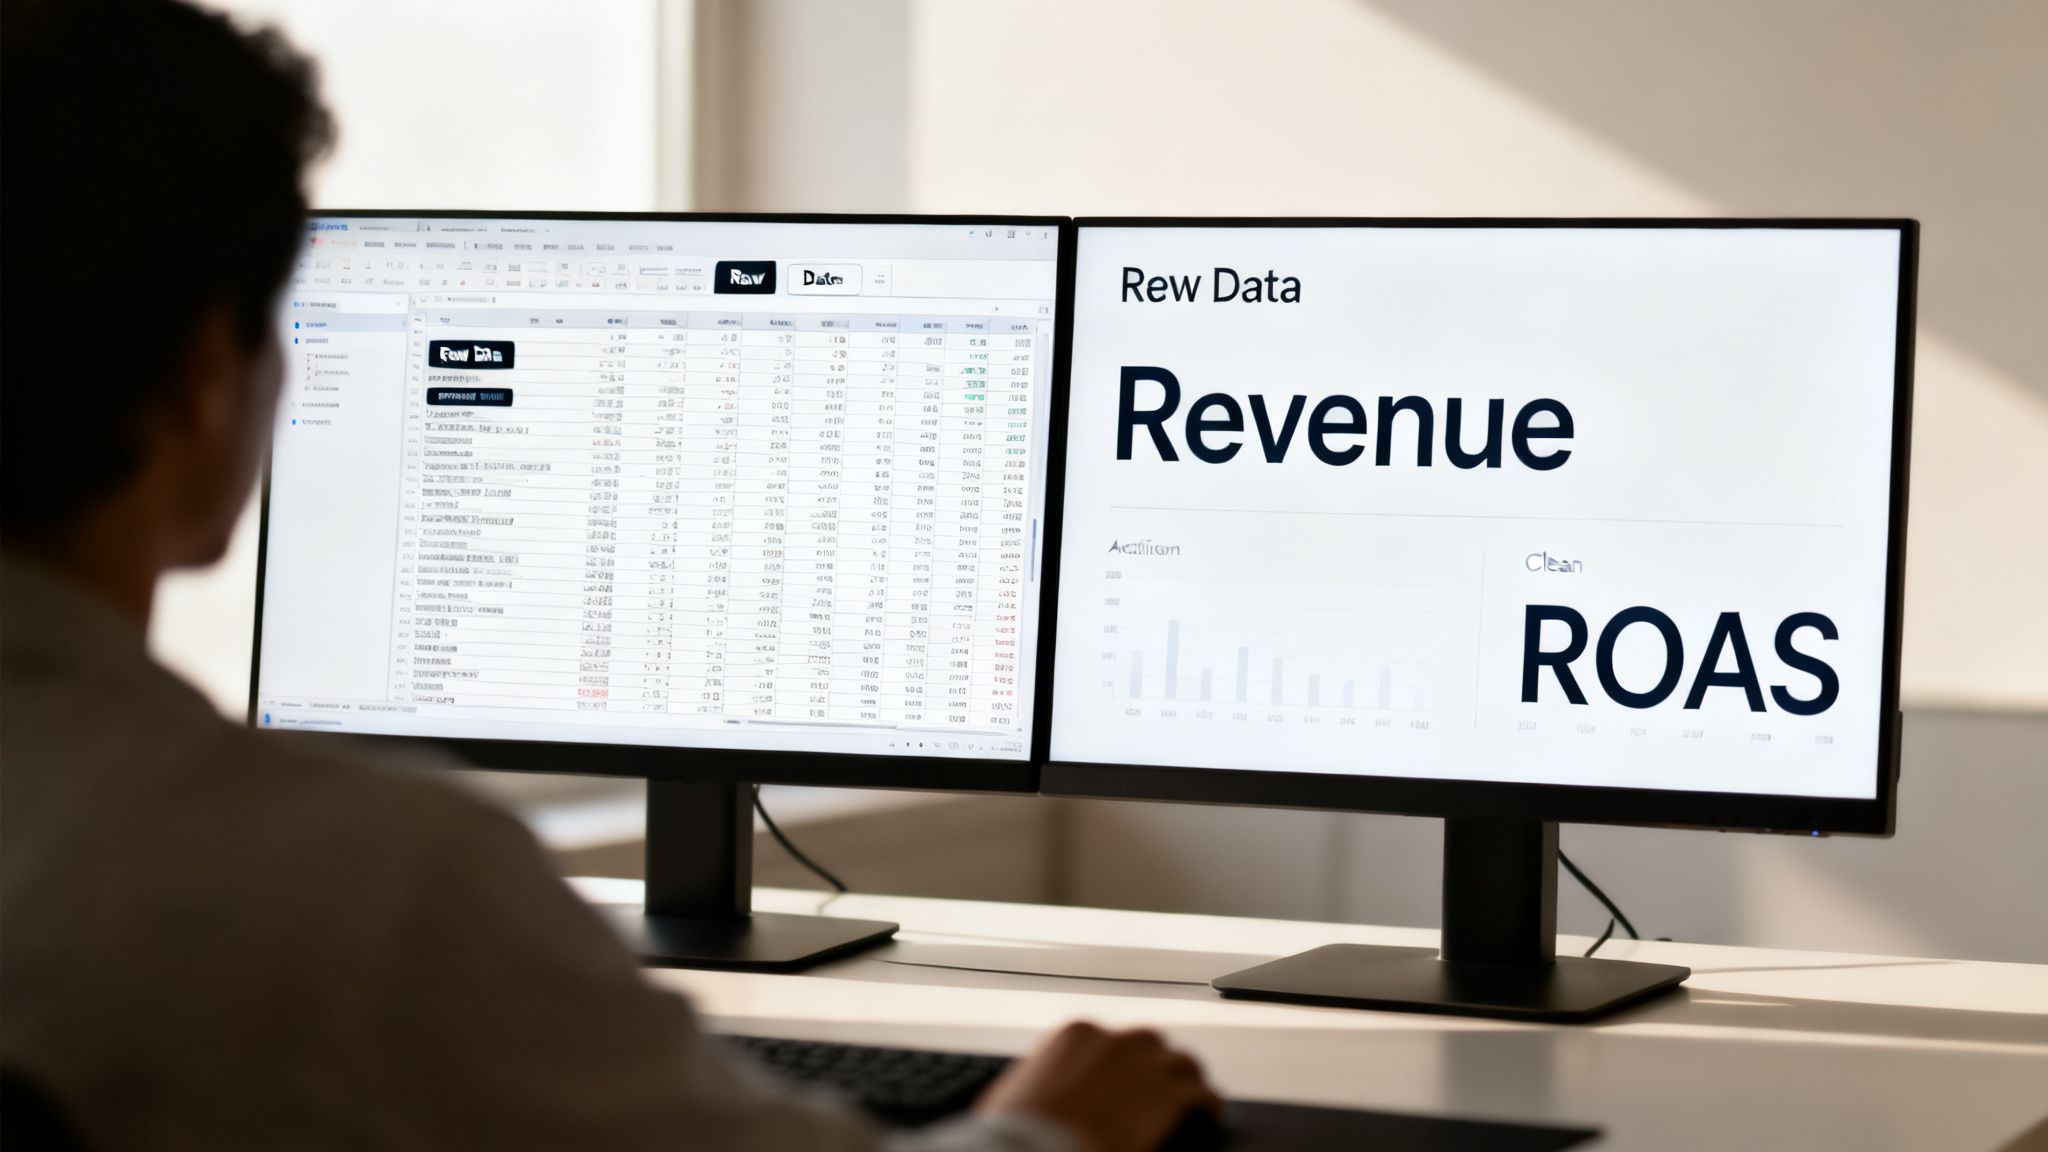
Let’s be honest, the default dashboards inside Meta Ads Manager often create more questions than answers. You’re hit with a sea of metrics—impressions, reach, link clicks—that all feel important but rarely connect directly to your bottom line.
This is the heart of the problem. Most reporting is passive. It shows you what happened, but it doesn't help you understand why it happened or what you should do about it next.
You get stuck in that frustrating loop of exporting CSV files, wrestling with pivot tables, and still feeling unsure about which ad creative is actually driving sales or which audience is the most profitable. This kind of reactive, backward-looking process makes it nearly impossible to scale your campaigns with any real confidence.
The Dangers of Vanity Metrics
One of the biggest traps you can fall into is chasing "vanity metrics." A high Click-Through Rate (CTR) looks impressive in a report, but it means absolutely nothing if those clicks aren't turning into paying customers.
Likewise, a super low Cost Per Click (CPC) might seem like a win for efficiency, but it could just mean you're attracting low-quality traffic that bounces immediately and never generates a dime of revenue.
Truly effective reporting cuts through the noise and zeroes in on business outcomes. It’s about answering the questions that actually matter:
- Which ad creative delivered the highest Return on Ad Spend (ROAS)?
- What is our true Customer Acquisition Cost (CAC) from this specific campaign?
- How is performance breaking down across placements like Reels vs. Stories?
The goal of great reporting isn't to create bigger spreadsheets. It's to find that one golden nugget of insight that gives you the confidence to double down on a winning campaign. True clarity comes from connecting ad spend directly to revenue.
Moving From Data Overload to Actionable Insights
This guide is designed to help you build a reporting framework that gets you out of those generic dashboards for good. We’re going to focus on creating a system that’s all about clarity and action, transforming your process from just pulling numbers to making data-backed strategic moves.
You'll learn how to tie your ad spend directly to revenue and start optimizing your campaigns with confidence. If you're feeling overwhelmed by all the moving parts, you might want to read more about how to navigate Meta Ads reporting complexity.
By the time we're done, you'll see your data not as a chore, but as your most powerful tool for growth.
Choosing Metrics That Actually Drive Business Goals
Before you even think about opening Ads Manager, let’s get one thing straight: the most critical part of building a useful report is knowing what "success" actually means for your business.
It's so easy to get lost in a sea of vanity metrics. Things like post likes or impressions look great on a spreadsheet and make you feel like you're getting traction, but they don't pay the bills. The real goal is to anchor your reporting to the numbers that directly reflect business outcomes.
This means shifting your focus to the heavy hitters—the Key Performance Indicators (KPIs) like Return on Ad Spend (ROAS), Cost Per Acquisition (CPA), and Customer Lifetime Value (LTV). These are the metrics that connect your ad spend to real-world revenue, telling you not just if people clicked, but if those clicks actually turned into something valuable.
E-commerce vs. SaaS: A Tale of Two KPIs
The right metrics depend entirely on your business model. Imagine two different companies running Facebook ads; their reports should look fundamentally different because what they're trying to achieve is night and day.
For an e-commerce brand, the North Star metric is almost always ROAS. The only question that really matters is, "For every dollar we spend on ads, how many dollars are we getting back in sales right now?" Their reporting will be laser-focused on metrics like Purchase Conversion Value and Cost per Purchase.
For a B2B SaaS company, the game is much longer. Their primary KPI might be Cost Per Lead (CPL) or, even better, Cost per Marketing-Qualified Lead (MQL). They need to know if their ads are efficiently generating high-quality leads that the sales team can nurture over weeks or even months.
This distinction is everything. An e-commerce brand obsessing over CPL is missing the forest for the trees, just as a SaaS company focusing only on day-one ROAS is completely ignoring the long-term value of a new subscriber. If you want to dive deeper, you can explore our detailed breakdown of the top Meta Ads performance metrics.
The Essential Metrics to Track for Your Objective
To make this crystal clear, here’s a quick-glance table breaking down the metrics you should be watching based on what you’re trying to accomplish with your campaign. Think of it as your cheat sheet for building reports that matter.
| Campaign Objective | Primary Metric (KPI) | Key Secondary Metrics |
|---|---|---|
| Awareness | Reach, Ad Recall Lift | Impressions, Frequency, Video Views |
| Traffic | Cost Per Landing Page View | Clicks (Link), CTR (Link), Landing Page Views |
| Engagement | Post Engagements, Page Likes | Comments, Shares, Cost Per Engagement |
| Lead Generation | Cost Per Lead (CPL) | Leads, Conversion Rate, Link Clicks |
| App Promotion | Cost Per App Install | App Installs, Mobile App Actions, CTR |
| E-commerce Sales | Return on Ad Spend (ROAS) | Cost Per Purchase, Purchases, Conversion Value |
Focusing on the right combination of primary and secondary metrics keeps you honest. It ensures you’re not just chasing clicks but are actually driving the specific outcomes that will grow your business.
Setting Realistic Benchmarks
Once you've identified your core KPIs, you need to give them context by setting benchmarks. Without a baseline, your numbers are just floating in a void. A $50 CPA could be an absolute steal for one business and a complete disaster for another.
The best place to start is your own historical data. What has your average CPA or ROAS looked like over the last six months? If you're just starting out, a quick search for industry benchmarks can give you a reasonable starting point. This foundational step is what turns a simple data dump into a strategic tool that reflects your true business performance.
The most powerful reports aren't the ones with the most data; they're the ones that clearly answer the most important question: "Is this campaign helping us achieve our primary business objective?"
At the end of the day, ROI remains the ultimate measure of success. And the good news? Meta's platforms are incredibly effective at delivering it. The average advertiser sees a 4x return on ad spend, a powerful testament to the platform's potential. Data shows that 70% of advertisers achieve a positive ROI within just three months.
When you optimize your campaigns specifically for conversions, you can see an even higher 2–3x ROI. This makes dialing in your reporting and focusing on the right metrics more important than ever. You can check out more compelling Facebook advertising statistics on marketingltb.com to see what's possible.
How to Build a Custom Dashboard in Ads Manager
The default view you get in Meta Ads Manager is fine as a starting point, but it's never where the real insights are hiding. If you want to find what you need to actually scale your campaigns, you have to build a custom dashboard that speaks directly to your business goals. This is how you turn that generic interface into your own powerful, in-house analytics tool.
The whole process hinges on one key feature: the "Columns" customization tool. Think of it as your command center for reporting. Instead of just taking whatever metrics Meta decides to show you, you get to actively choose which data points matter, how you want to break them down, and even the attribution window you use to define success. This is where you stop looking at data and start making decisions with it.
Creating a Practical Creative Analysis Report
Let's get practical and walk through a real-world example. One of the biggest questions we all have as marketers is, "Which of my ad creatives are really working?" A generic report just muddies the water. So, we'll build what I call a "Creative Analysis Report" to cut through the noise and spot the winners.
The goal here is simple: add columns that tell the full story of how a user interacts with your ad, from the moment they see it to the final conversion.
Here’s a quick look at what this custom report can look like once you’ve got your key columns in place.
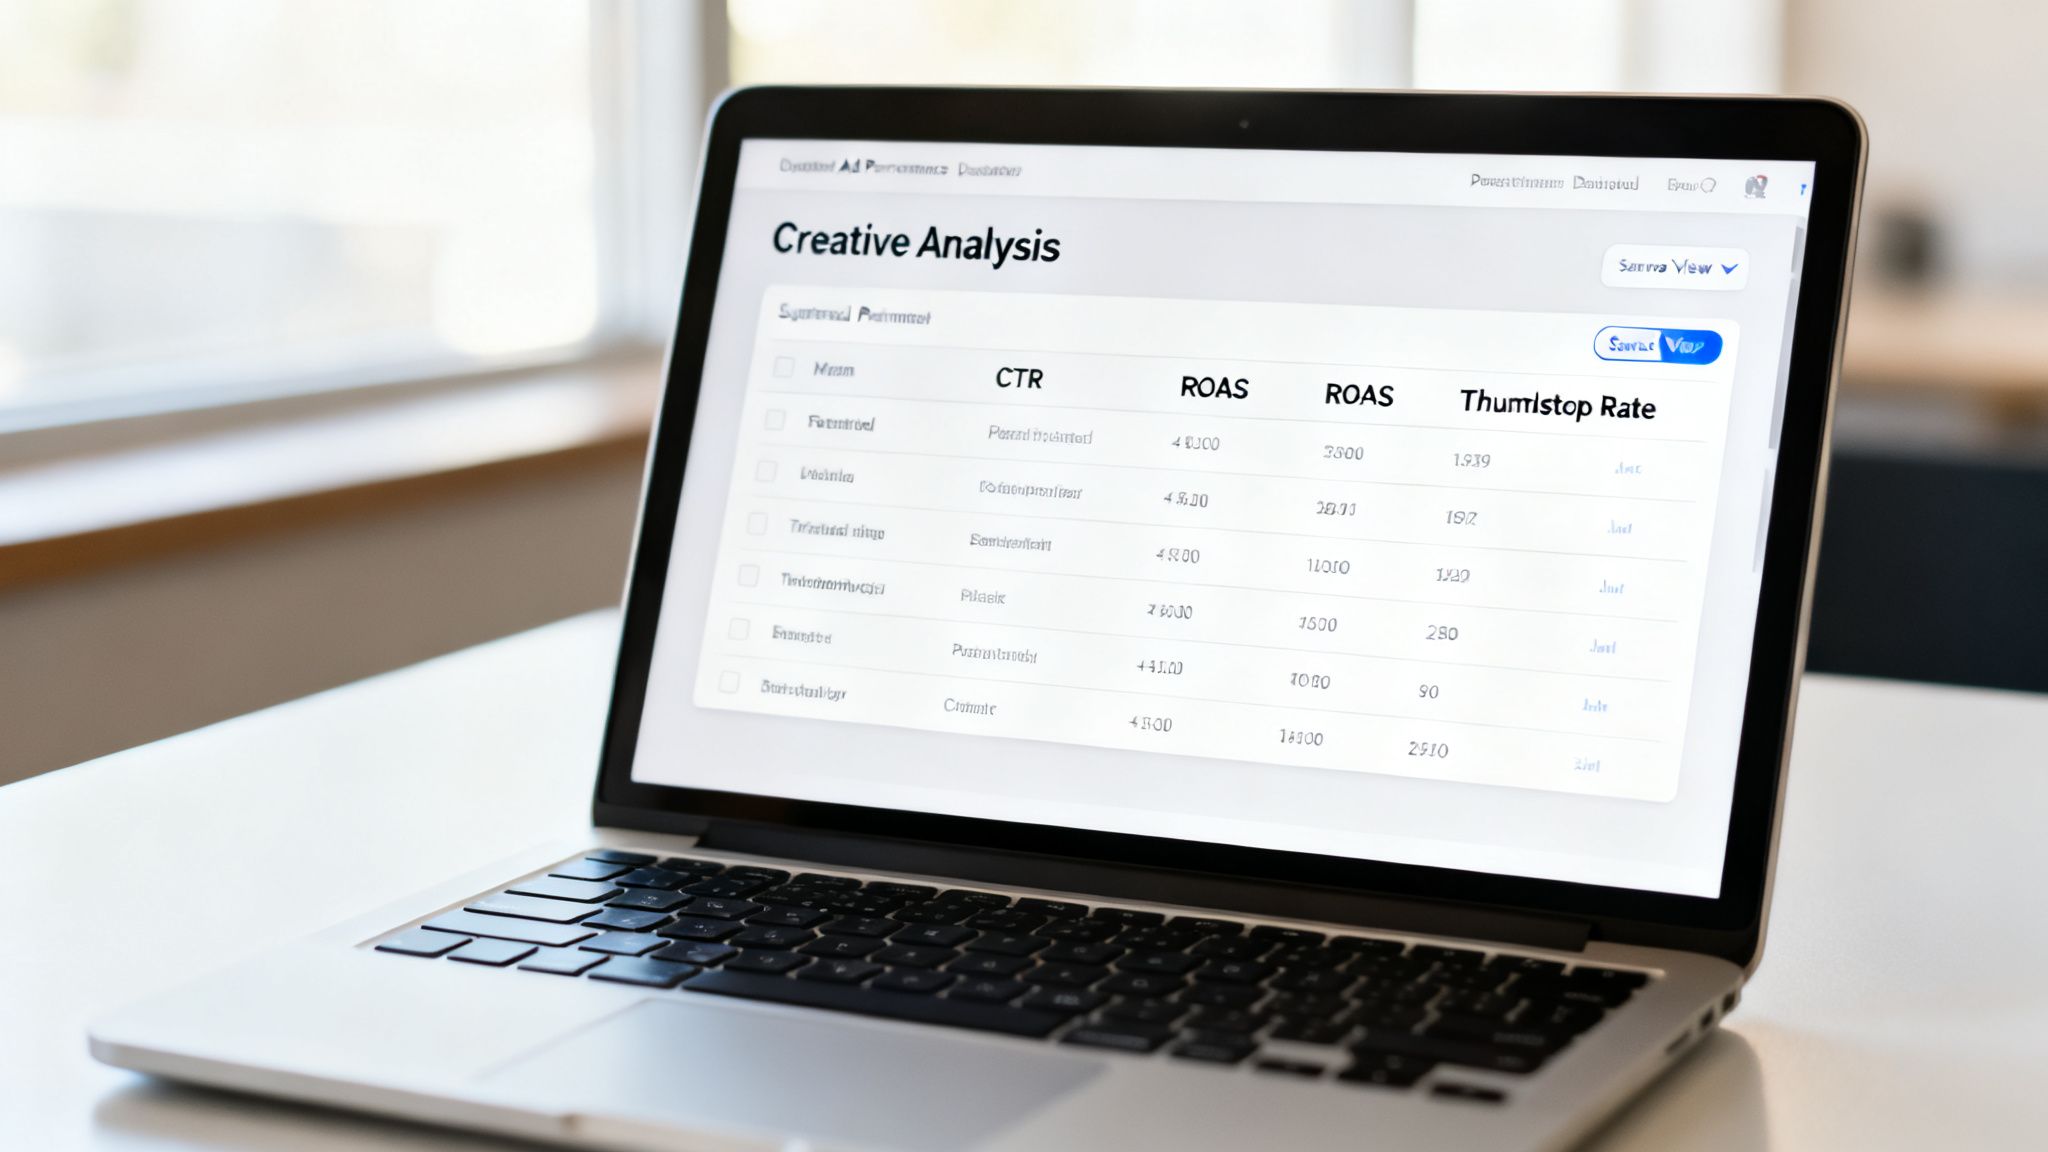
This view makes it incredibly easy to compare different images, videos, and ad copy variations at a glance.
To build this yourself, just go to the "Columns" dropdown and hit "Customize Columns." From there, start searching for and adding the metrics that actually matter for creative analysis:
- Thumbstop Rate (3-Second Video Plays / Impressions): Is your video's hook strong enough to stop the scroll? This is your first and most critical engagement metric for video creative.
- CTR (Link Click-Through Rate): This tells you how compelling your creative and copy are. Are people interested enough to actually click?
- Cost per Landing Page View: This goes a step beyond CPC. It tells you how efficiently you're getting qualified traffic to land on your site, not just click a link.
- Cost per Purchase: For any e-commerce brand, this is the bottom line. How much does it cost to get a sale?
- Purchase ROAS (Return On Ad Spend): The ultimate measure of profitability. For every dollar you put in, how many are you getting back from each creative?
By pulling these metrics into a single view, you can immediately spot patterns. You might find a video with a fantastic Thumbstop Rate but a terrible CTR. That's an actionable insight right there—it tells you the hook is great, but the call-to-action or offer isn't landing.
Saving Your Custom View for Efficiency
Once you've built a report that perfectly answers a key business question, don't let that work disappear. Use the "Save" function and give it a clear, descriptive name like "Ecomm Creative Analysis." Now, that exact view is just two clicks away, every single time. This keeps your reporting consistent and saves a ton of time.
This isn't just a neat trick; it's fundamental to effective fb ads reporting. Instead of rebuilding reports from scratch, you end up with a library of saved views, each designed to monitor a specific part of your strategy—from creative performance to audience deep dives. If you're still getting your bearings on the platform, our guide on what Facebook Ads Manager is and how it works can help you master the basics.
It also helps to have some context for what "good" looks like. For example, recent data shows traffic campaigns are doing surprisingly well, with the average CTR climbing to 1.71% and a CPC of just $0.70. Knowing these benchmarks helps you understand if your custom dashboard is showing you performance that's above or below average. You can dig into more insights about Facebook advertising benchmarks from Hootsuite's analysis to ground your reports in reality.
Uncovering Deeper Insights with Breakdowns and UTMs
Alright, you've got a solid custom dashboard built. Now it's time to stop looking at surface-level metrics and start asking the real strategic questions. This is where Meta's "Breakdown" feature becomes your best friend. Think of it as your magnifying glass for campaign data, letting you segment everything to find the hidden trends actually driving your results.
Instead of just staring at a campaign's overall performance, you can slice and dice the data to see exactly where your budget is hitting its stride. For instance, do you think your ads are doing better on Reels than on Instagram Stories? A quick breakdown by Placement will settle the debate, showing you the hard numbers for ROAS and CPA in each specific spot.
The same idea applies to geography. You might be running a national campaign, but what if one high-performing city is carrying all the weight? By using the Region breakdown, you can pinpoint which areas are bringing in the most conversions. That's powerful intel you can use to either double down on that location or build lookalike audiences from it.
Bridging the Gap with UTM Tracking
While breakdowns give you incredible insight inside the Meta ecosystem, they don't tell you a thing about what happens after someone clicks your ad. That's the missing piece of the puzzle, and UTM parameters are how you find it. UTMs (Urchin Tracking Modules) are just simple tags you add to your ad's destination URL that tell tools like Google Analytics exactly where your traffic is coming from.
Without them, all your paid social traffic just gets dumped into one big, generic bucket. You'll have no way to attribute revenue back to a specific campaign, ad set, or even a particular ad creative. For marketers looking to truly understand performance beyond surface-level metrics, consider leveraging advanced AI data analysis techniques to process your FB Ads data more efficiently.
UTMs are the bridge between your on-platform Facebook metrics and your actual business impact. They connect the $10 CPA you see in Ads Manager to the $150 average order value recorded in Google Analytics.
A Practical UTM Structure for Clear Reporting
The secret to making UTMs work is consistency. A messy, slapdash approach will only create a data nightmare. Here’s a simple, effective template I use for all my Facebook ads:
- utm_source=facebook: This identifies the platform. Simple.
- utm_medium=cpc: This specifies that it's paid traffic (cost-per-click).
- utm_campaign={{campaign.name}}: Dynamically pulls in your campaign name.
- utm_content={{adset.name}}: Dynamically pulls in your ad set name.
- utm_term={{ad.name}}: Dynamically pulls in the specific ad name.
By using Meta's dynamic URL parameters—those little bits in the {{}} brackets—Ads Manager automatically fills in the names for you. This makes your tracking accurate and scalable without any extra manual work. With this simple setup, you can log into Google Analytics and see precisely which campaigns and creatives are driving the most valuable post-click actions, whether that's newsletter sign-ups or big-ticket purchases. That level of detail is absolutely critical, especially when you need to understand the full customer journey, a topic we explore further in our guide to the Meta Conversions API.
How to Automate and Scale Your Reporting Workflow
If you're still pulling reports manually, you're stuck in the weeds. It's tedious, spreadsheet-heavy work that chains you to data collection when you should be focused on high-level strategy. Building an efficient, scalable reporting system is what separates the data-pullers from the decision-makers.
The easiest first step is right inside Ads Manager: the built-in scheduling feature. You can set up those custom reports you’ve already built to land in your team's inboxes daily, weekly, or monthly. This keeps key stakeholders in the loop with zero extra effort from you.
Connecting to Business Intelligence Tools
For reporting that’s more dynamic and interactive, the next logical move is connecting your Meta Ads data to a business intelligence (BI) tool. Platforms like Looker Studio (what used to be Google Data Studio) or Tableau let you pull data from multiple sources into a single, unified dashboard.
This gets you far beyond static email attachments. With a BI tool, you can create interactive charts and graphs that let anyone drill down into performance with a click. It’s a much better way to spot trends and share insights across your organization—no one has to squint at a spreadsheet again.
This flow is all about turning raw clicks into real business intelligence.
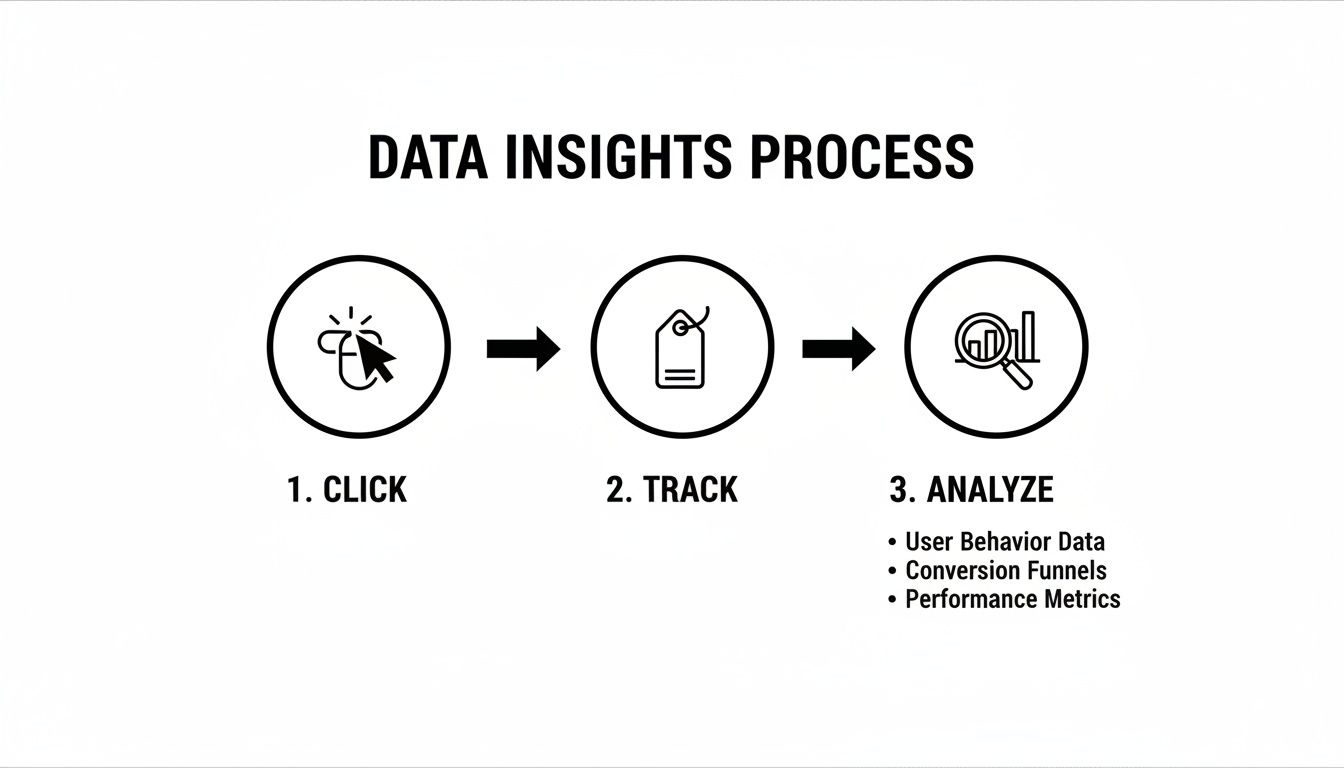
As the diagram shows, every single user action has to be tracked and analyzed before it can become a meaningful insight you can actually use.
Leveraging AI for Actionable Insights
BI tools are great for automating data visualization, but the real game-changer is using AI-powered platforms to automate the analysis itself. This is how you stop just looking at what happened and start understanding why it happened—and what you should do next.
True automation isn't just about scheduling data pulls; it's about using technology to surface strategic recommendations that you can act on immediately. This is how you find the signal in the noise and scale your campaigns with confidence.
These advanced tools hook directly into your ad accounts and chew through your historical performance data to find hidden patterns. Instead of you manually sifting through endless creatives and audiences, an AI-driven system can rank your top performers against your specific goals, whether it’s ROAS, CPA, or another key metric.
With over 10 million active advertisers on Meta's platforms, the competition is fierce. The average click-through rate (CTR) across all industries hovers around 1.44%, while top-tier conversion rates hit a healthy 9.21%. These numbers show just how critical efficiency is. Tools like AdStellar AI are built for this exact challenge; by analyzing historical data, they automate the scaling of winning ads, helping advertisers boost ROI by up to 4x on average. You can dig into more insights about Facebook ad statistics on electroiq.com.
This shift is fundamental. It frees you from the endless cycle of report-building and lets you focus your energy on executing the strategic insights the system uncovers. When you embrace this level of automation, you move faster, make smarter decisions, and ultimately drive much better results. To see how these tools stack up, check out our guide on the best Facebook Ads reporting software on the market.
Common Questions We Hear About FB Ads Reporting
Even with the slickest reporting setup, you’re still going to have questions. After years in the trenches with performance marketers, I’ve found that the same challenges and head-scratching moments pop up time and time again. This section is all about giving you direct, no-fluff answers to those nagging questions.
The goal is to clear up the gray areas so you can make confident, data-backed decisions without second-guessing yourself. Let's get into it.
How Often Should I Check My FB Ads Reports?
When you have active campaigns in the market, a quick daily check-in is non-negotiable. I'm not talking about a deep, hour-long analysis. This is your five-minute pulse check to spot any glaring red flags—a sudden nosedive in CTR, a broken link sending your CPA through the roof, or an ad set that's burning cash for no reason. Catching these early can save you a world of pain (and budget).
But the real, meaningful insights don't come from staring at hourly data. That comes from your deeper, weekly analysis. This is when you should block out some real time, sit down, and look for performance trends over a 3 to 7-day period.
The single biggest mistake I see marketers make is reacting to a single day of bad data. Performance fluctuates. It’s normal. Don't make knee-jerk optimizations until you see a consistent pattern emerge.
Why Don’t My Facebook and Google Analytics Numbers Match?
Ah, the classic dilemma. If I had a dollar for every time this question came up... The short answer is: they’re not supposed to match perfectly. It almost always boils down to one thing: different attribution models. The numbers aren't "wrong"—they're just telling different stories based on different sets of rules.
- Facebook's Story: Meta usually operates on a 7-day click and 1-day view model. This means it takes credit for a conversion if someone clicked your ad in the last week or even just saw it in the last 24 hours before converting. It’s a broader view of influence.
- Google's Story: Google Analytics often defaults to a last-click model. It’s more straightforward, giving 100% of the credit to whatever the final touchpoint was that brought the user to your site right before they converted.
So, how do you bridge the gap? Consistent UTM parameters are your best friend here. By tagging your ads properly, you can see your Facebook campaign data right inside Google Analytics. This doesn't make the numbers match, but it gives you a much clearer, more holistic picture of the complete customer journey.
What Is a Good ROAS for Facebook Ads?
This is the million-dollar question, and the answer is always, "It depends." There is no universal "good" Return on Ad Spend (ROAS). You’ll often hear a 4:1 ratio ($4 back for every $1 spent) thrown around as a healthy benchmark, but chasing that number blindly is a recipe for disaster.
The right ROAS target is completely tied to your business's unique profit margins. It's that simple.
For instance, a DTC brand selling high-margin products might be incredibly profitable at a 3:1 ROAS. On the flip side, a business with razor-thin margins might need to hit a 10:1 ROAS just to break even.
The only way to know your number is to calculate your own break-even ROAS. Once you know the exact point where every dollar you spend starts generating profit, you can finally set performance targets that are realistic and actually mean something for your bottom line.
Ready to stop guessing and start scaling? AdStellar AI automates your reporting and surfaces actionable insights, so you can focus on strategy, not spreadsheets. See how much faster you can grow your campaigns at https://www.adstellar.ai.