Return on Ad Spend (ROAS) is the one metric that tells you, in plain dollars and cents, if your advertising is actually working. It answers the most fundamental question for any advertiser: for every dollar I put into ads, how much revenue am I getting back?
Think of it as the ultimate reality check. A high ROAS means you've built a profitable advertising machine. A low ROAS is a red flag, signaling that you might be pouring money down the drain.
Defining Return On Ad Spend

The easiest way to grasp ROAS is with the vending machine analogy. Your ad budget is the dollar you slide into the slot. The revenue you generate from those ads is the snack that drops down.
ROAS tells you the value of that snack. If you put $1 in and get a $5 snack out, that’s a fantastic return. But if you put $1 in and only a $0.50 candy comes out, you're losing money on every transaction.
This simple, powerful calculation is why ROAS has become the universal language of performance marketing. It cuts right through the noise to tell you what matters most: profitability.
Moving Beyond Clicks and Impressions
It’s easy to get distracted by metrics like Click-Through Rate (CTR) or Cost Per Click (CPC). While they have their place, they only paint a partial picture of your campaign's health.
A campaign can get thousands of clicks and look great on paper, but if none of those clicks turn into actual sales, it’s a failure. A high CTR tells you your ad is grabbing attention, but ROAS tells you if that attention is turning into money for your business. It connects the dots between ad spend and the bottom line.
Key Takeaway: ROAS isn't just another ad metric; it's a business metric. It forces a shift in focus from mere campaign activity to genuine campaign profitability, aligning your marketing spend directly with financial goals.
For a quick reference, here’s a simple breakdown of the key components of ROAS.
ROAS At a Glance
| Component | Description | Example |
|---|---|---|
| Ad Spend | The total cost of your advertising campaign. | You spend $1,000 on a Google Ads campaign. |
| Revenue | The total income generated directly from that ad spend. | The campaign generates $5,000 in sales. |
| ROAS Ratio | The resulting multiplier showing your return. | Your ROAS is 5:1 ($5,000 / $1,000). |
This table shows just how straightforward the concept is, yet its impact on decision-making is profound.
Why ROAS Is a Fundamental Metric
Understanding ROAS is non-negotiable for any marketer who wants to scale their efforts effectively. It provides the financial clarity needed to make smarter budget decisions. By obsessing over this one number, you can:
- Justify Marketing Spend: Show stakeholders exactly how much revenue your campaigns are driving. No more vague conversations about "brand awareness."
- Optimize for Profitability: Pinpoint the exact campaigns, ad sets, and creatives that deliver the best financial returns, then double down on them.
- Scale with Confidence: Pour more money into your winning strategies, knowing they're backed by hard data proving their profitability.
Ultimately, ROAS is one of the most critical performance marketing metrics because it translates your campaign data into a language the entire business understands: results. It’s the compass that guides every profitable advertising decision you make.
Calculating Your ROAS With Step-By-Step Examples
Alright, now that we’ve covered what ROAS is, let's get our hands dirty and actually calculate it.
Putting this metric into practice is surprisingly simple, yet it's the absolute lifeblood for any performance marketer who wants to scale campaigns profitably. The whole thing boils down to one straightforward formula.
The ROAS Formula: Total Revenue from Ad Campaign / Total Cost of Ad Campaign = Return on Ad Spend
This simple division gives you a ratio that tells a powerful story. A ROAS of 4:1, for instance, means that for every $1 you put into ads, you got $4 back in revenue. It's this kind of clarity that has fueled the explosive growth in digital advertising, with global spending projected to hit a staggering $740.3 billion in 2024. Brands are flocking to channels where they can precisely measure what comes back.
Let's walk through a couple of real-world scenarios to see how this plays out.
Example 1: The E-commerce Campaign
Imagine you run an online store that sells custom coffee mugs. You decide to launch a campaign on Meta (Facebook) to show off a cool new design.
- Figure Out Your Ad Cost: You spend $500 on the campaign over one week.
- Track Your Revenue: Thanks to the Meta Pixel, you can see that $2,500 in sales came directly from this campaign.
- Calculate Your ROAS:
- $2,500 (Revenue) / $500 (Ad Cost) = 5
Boom. Your ROAS is 5, or 5:1. For every dollar you invested, you earned five back. That's a strong signal that, at least on the surface, this campaign is a winner.
Example 2: The Lead Generation Campaign
Things get a little trickier with lead generation because a new lead doesn't have an immediate price tag. The key here is to figure out what a lead is actually worth to your business.
Let's say you're a B2B SaaS company. You've done the math and know that, on average, it takes 10 leads to land one paying customer, and your average customer lifetime value (LTV) is $2,000.
- Calculate Your Lead Value: $2,000 (LTV) / 10 (Leads needed for one sale) = $200 per lead.
- Run the Campaign: You spend $1,000 on a LinkedIn campaign and generate 15 qualified leads.
- Calculate Attributed Revenue: 15 (Leads) x $200 (Value Per Lead) = $3,000.
- Calculate Your ROAS:
- $3,000 (Attributed Revenue) / $1,000 (Ad Cost) = 3
Your ROAS here is 3:1. This approach allows businesses without a simple "add to cart" button to connect their ad spend to real business outcomes, even if the sales cycle takes a while. It's an essential step.
Understanding this metric is a key part of the broader concept of marketing ROI. If you want to go deeper, check out our guide on how to calculate marketing ROI for the full picture.
Understanding Good ROAS Benchmarks
So, what’s a good ROAS? It’s one of the first questions every marketer asks, and the honest-to-goodness answer is… it depends. A "good" ROAS isn't a universal number pulled out of thin air. It’s a moving target that hinges entirely on your business model, your profit margins, and your industry.
Think about it this way: for a B2B SaaS company selling software, a 3:1 ROAS might feel like hitting the jackpot. Why? Because the cost to deliver one more subscription is practically zero, so most of that return is pure profit.
Now, flip the script to a low-margin business, like a retail store selling electronics. That same 3:1 ROAS would be a disaster. They might need a ROAS of 8:1 or even 10:1 just to break even after paying for the products, shipping, and all the other operational costs.
The most crucial takeaway is that a strong ROAS is one that leaves you with a healthy profit after all your costs are paid. It’s less about hitting an industry-wide number and more about understanding your own business's financial health.
Industry Averages as a Starting Point
While your own numbers are king, looking at industry benchmarks can give you a solid reality check. These averages reflect the unique economic DNA of each sector—from product costs to how long it takes to win a customer. Knowing where you stand can help you set much more realistic targets for your campaigns.
Here’s a look at some typical ROAS benchmarks to give you a frame of reference.
Average ROAS Benchmarks by Industry
| Industry | Average ROAS Target | Key Considerations |
|---|---|---|
| E-commerce | 4:1 to 6:1 | Margins are often tight, requiring a higher ROAS to cover product costs, shipping, and returns. |
| B2B SaaS | 3:1 to 5:1 | High lifetime value and low marginal costs mean a lower ROAS can still be very profitable. |
| Retail | 6:1 to 8:1 | Similar to e-commerce but often with higher overhead from physical locations. |
| Legal Services | 5:1 to 7:1 | High-value clients justify significant ad spend, but competition can be fierce. |
Use these numbers as a guidepost, not a rulebook. They’re a helpful start, but they should never replace a deep dive into your own financials. Your breakeven point is the most important benchmark of all.
For more platform-specific insights, you can explore whether Facebook advertising works for different business models and what kind of returns you might expect.
Analyzing ROAS For Deeper Insights
A single, campaign-wide ROAS number is a good starting point, but it's a bit like looking at a football game's final score without watching the highlights. You know who won, but you have no clue why. The real magic—the optimization that drives serious growth—happens when you break that top-level number down and understand the individual plays that led to the win.
This is where a more granular analysis of your Return on Ad Spend becomes your most powerful diagnostic tool. By dissecting your ROAS at different levels, you can uncover hidden pockets of high performance and pinpoint the exact elements dragging your average down. A campaign with a solid 4:1 ROAS might be masking a killer creative that's hitting 8:1 and a terrible one just wasting budget at 1:1.
Digging Into Different ROAS Levels
To get insights you can actually act on, you have to look beyond the dashboard summary. The most effective advertisers analyze ROAS across three key dimensions to figure out what truly drives revenue.
Campaign-Level ROAS: This is your standard, 30,000-foot view. It tells you the overall profitability of a specific campaign, making it perfect for broad budget allocation decisions. Is the "Summer Sale" campaign pulling its weight? This number tells you.
Creative-Level ROAS: Now we're getting interesting. This is where you see which specific visuals, videos, and ad copy actually connect with your audience. You might discover that grainy, user-generated content is crushing your polished studio shots, or that a certain headline drives twice the revenue of another.
Audience-Level ROAS: This reveals your most profitable customer segments. Are you getting better returns from your lookalike audiences or your interest-based targeting? Analyzing ROAS by demographics, interests, or custom audiences helps you find high-value groups to scale and identifies segments that just aren't converting.
This tiered approach transforms ROAS from a simple grade into a detailed report card. You can see exactly where you're excelling and where you need to put in the work.
By isolating variables, you stop guessing and start making data-backed decisions. You can confidently turn off what's broken, scale what's working, and replicate your successes across future campaigns.
The massive shift toward measurable digital channels has made this level of analysis not just possible, but essential. Back in 2020, while offline ad spend saw its worst decline in 40 years, online ad spend shot up by 9.4%—a trend that's only picked up steam since. According to research from WARC.com, this digital migration continues to accelerate.
For B2B and SaaS teams, this means focusing on platforms where every dollar can be meticulously tracked. Top-tier Meta campaigns can often hit a 4:1 ROAS, but we've seen AI-driven testing push that number to 6:1 or even higher.
Ultimately, detailed analysis is the foundation of any robust advertising strategy. To learn more about structuring your data for this kind of clarity, check out our guide on effective Facebook Ads reporting.
Common ROAS Pitfalls To Avoid
Knowing your ROAS is critical, but treating it as the only measure of success is a trap countless marketers fall into. A high ROAS can easily hide serious problems simmering beneath the surface, while a low ROAS might actually signal a long-term win. If you rely on it blindly without understanding its limitations, you can make some seriously bad calls that stunt your growth.
For instance, a campaign pulling in a fantastic 6:1 ROAS might be driving sales for a low-margin product, meaning it's barely contributing to your actual profit. On the flip side, a campaign with a seemingly weak 2:1 ROAS could be bringing in new customers who become loyal, repeat buyers for years. The initial number just doesn't tell the whole story.
The Attribution Modeling Dilemma
How you give credit for a sale—a process called attribution modeling—can completely warp your ROAS figures. Most platforms default to a "last-touch" model, which gives 100% of the credit to the final ad a customer clicked before buying.
The problem? That approach completely ignores all the other touchpoints that warmed the customer up, built brand awareness, and guided them down the funnel. A first-touch model does the exact opposite. Neither is perfect, and sticking to just one gives you a distorted view of which campaigns are truly valuable.
The diagram below shows how you can break down ROAS analysis from a high-level campaign view into more granular, actionable insights.
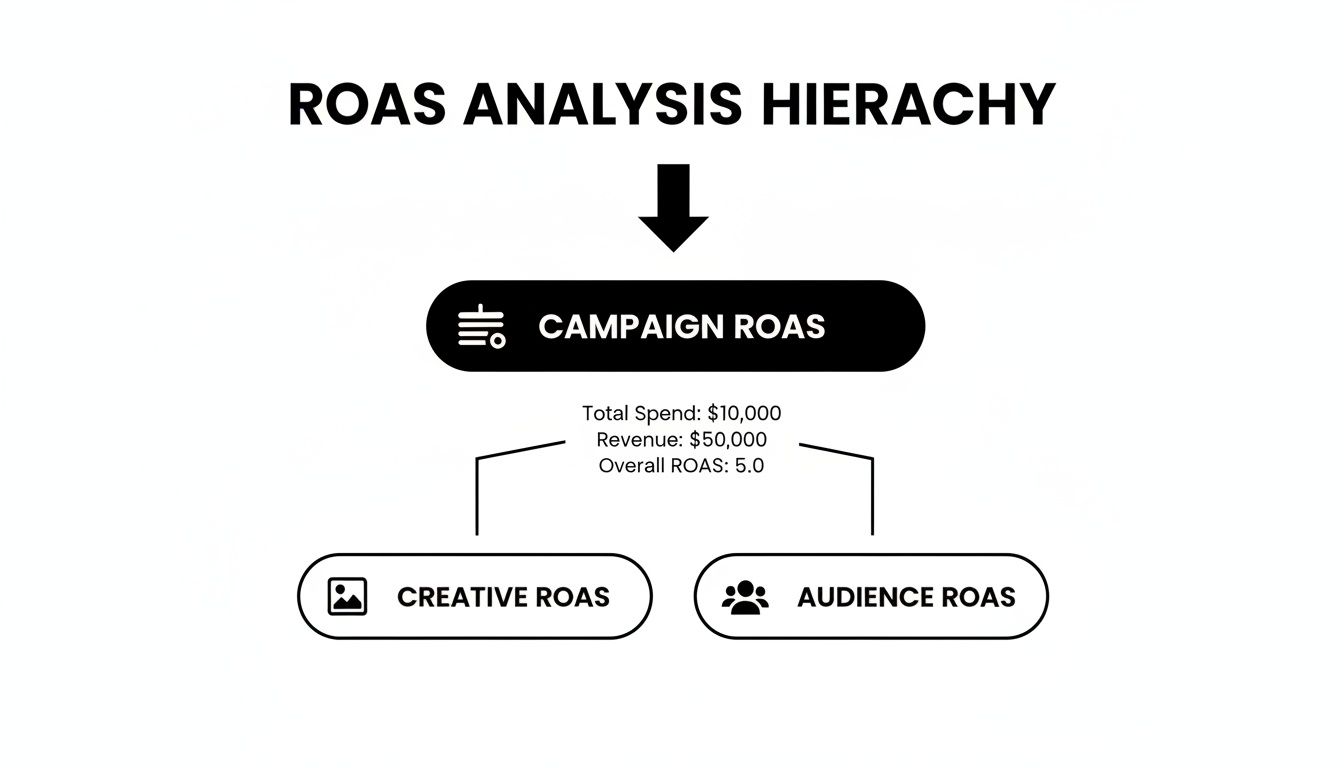
This hierarchy makes it clear: a single campaign ROAS is just the starting point. The real magic happens when you dig into creative and audience performance.
Overlooking Customer Lifetime Value
One of the biggest mistakes you can make is ignoring Customer Lifetime Value (LTV). ROAS typically measures the immediate return from a single purchase, but what about the next five purchases that same customer makes over the next two years?
A campaign that acquires customers with a high LTV might have a lower initial ROAS but be far more profitable in the long run. Focusing only on immediate returns can cause you to shut down campaigns that are building a sustainable customer base for your business.
Forgetting About Brand Awareness
Let's be real: not every ad is designed to drive an immediate sale. Brand awareness campaigns are all about introducing your company to new audiences and building trust over time. These top-of-funnel efforts rarely have a high direct ROAS because their goal isn't direct conversion—it's to fill the pipeline for future sales.
Judging these campaigns by the same ROAS standards as a bottom-of-funnel retargeting ad is a recipe for disaster. You have to evaluate campaigns based on their specific goals within your broader marketing strategy.
How AdStellar AI Supercharges Your ROAS

Trying to manually boost your ROAS is a grind. You're constantly fighting the clock, wrestling with complexity, and making educated guesses at best. Finding that perfect combination of creative, copy, and audience targeting can feel like searching for a needle in a haystack.
This is exactly where AI flips the script. It turns a slow, reactive process into a fast, predictive one.
AdStellar AI was built from the ground up to solve this problem. Our platform automates the mind-numbing work of creating and testing hundreds—or even thousands—of ad variations. It helps you find winning formulas at a scale that’s simply not possible for any human, or even a team of humans, to manage alone.
Automate Creative and Audience Testing
Forget launching a handful of ads and crossing your fingers. AdStellar AI lets you build and deploy hundreds of creative, copy, and audience combinations in minutes. This sheer volume of testing generates performance data at a breakneck pace, giving the AI the feedback it needs to quickly figure out what clicks with your most valuable customers.
Our AI Insights feature then cuts right through the noise. It crunches all that performance data and ranks your best ad combinations against your specific ROAS goals. You can see, clear as day, which visuals, headlines, and audiences are bringing in the highest returns. This lets you confidently double down on what’s working and kill the campaigns that are just burning cash.
By automating the entire test-and-learn cycle, AdStellar AI shifts your strategy from guesswork to data-backed execution. You can accelerate your campaign learning speed by up to 10x while consistently hitting 3x+ returns.
Getting this right is more important than ever. With global ad spend projected to blow past $1 trillion in 2026, the marketers who can allocate their budgets most efficiently will own the future.
Continuously Scale Winning Campaigns
Finding a winning ad is just half the battle. Scaling it effectively is where the real growth happens.
AdStellar’s AI Launch feature uses self-learning models to keep a constant eye on campaign performance. The moment a high-performing ad combination is flagged, the system automatically shifts more budget its way. This ensures your ad spend is always flowing to the campaigns proven to deliver your best ROAS.
This intelligent automation means you never miss a chance to scale a winner. The platform handles this entire process on its own, so your campaigns are always optimizing, 24/7, even when you’re not in the dashboard.
Want to see how it all works under the hood? Check out AdStellar’s AI Optimization capabilities.
And if you want to dig into more practical ROAS improvement strategies that go beyond just AI, there are plenty of great resources out there to explore.
Got Questions About ROAS?
Even after you get the hang of Return on Ad Spend, a few practical questions always seem to pop up. Here are some quick, straightforward answers to the things marketers stumble over when they start using ROAS day-to-day.
What Is The Difference Between ROAS And ROI?
Think of it like this: ROAS is a magnifying glass, and ROI is a wide-angle lens.
ROAS zooms in specifically on your advertising. It answers one simple question: "For every dollar I put into ads, how much revenue did I get back?" It's all about the effectiveness of your campaign creative, targeting, and offer at generating top-line sales.
Return on Investment (ROI), on the other hand, zooms out to look at the entire business picture. It calculates your profit after subtracting all the costs associated with making that sale—not just ad spend. We're talking about the cost of the product itself, shipping, software, salaries, you name it. A campaign can have a fantastic ROAS but a terrible ROI if your profit margins are too thin.
What Should I Do If My ROAS Is Consistently Low?
First off, don't panic. A low ROAS isn't a failure; it's a signal that something in your advertising mix isn't clicking. It’s time to put on your detective hat and dig into the data.
- Go granular: Is the low ROAS dragging down your whole account, or is it isolated to one campaign, a specific audience, or a single ad creative? Find the weak link.
- Shake things up: It might be time to refresh your creative and copy. Try testing completely different angles or hooks. Experiment with new audience segments you haven't tried before.
- Look beyond the ad: Sometimes the ad is doing its job, but the problem lies in what happens after the click. Is your landing page clear and compelling? Is your pricing out of sync with the market?
A consistently low ROAS is just data telling you that a particular combination of message, audience, and offer isn't working. Use that feedback to iterate and test, not to abandon a channel entirely.
How Often Should I Check My ROAS?
This really depends on the pace of your business and how much you're spending. There’s no single right answer.
For fast-moving e-commerce brands, especially during a big sale or holiday push, checking ROAS daily is a must. You need to be able to spot trends and make quick adjustments before you burn through your budget.
But for businesses with a longer sales cycle, like a B2B software company, leads might take days or weeks to convert. Checking ROAS weekly is much more practical in this case. It gives the data enough time to mature so you're not making knee-jerk decisions based on a few hours of fluctuating performance.
Ready to stop guessing and start scaling your ads with confidence? AdStellar AI automates the creation, testing, and optimization of your Meta campaigns to supercharge your ROAS. Discover how AdStellar can help you find winning ad combinations 10x faster.