Let’s be honest, client reporting often gets a bad rap. It’s that task lingering at the end of the week, hastily pulled together with a few screenshots and quick notes just to check a box.
But treating reporting as a chore is a massive missed opportunity. What if, instead of being a burden, your reports became your single most powerful tool for keeping clients happy and growing their accounts?
Turn Reporting Into Your Strongest Retention Tool

When you reframe reporting from a simple task to a strategic advantage, you can completely change the client dynamic. It stops being about accountability and starts being the primary way you demonstrate the incredible value your team delivers, day in and day out.
The True Cost of Poor Reporting
When clients are left in the dark, they start to wonder what exactly they’re paying for. A lack of clear, insightful reporting is one of the fastest ways to erode trust. It creates an information vacuum that clients almost always fill with doubt, eventually leading them to question the value of the partnership and start looking elsewhere.
This isn’t just a hunch; it’s a critical business reality. In fact, a striking 70% of agency leaders rate client reporting as 'extremely important' for keeping clients on board. The data paints a clear picture: there's a direct line between the quality of your reporting and the loyalty of your clients, a connection explored in the full 2025 Marketing Agency Benchmarks Report.
From Data Dump to Strategic Narrative
The key is to move beyond static spreadsheets and generic data points. A great report tells a story—a compelling one about performance. It connects the dots between your day-to-day activities and the client’s most important business goals.
Every report you deliver is a chance to reinforce your value. To do that, it needs to move beyond just numbers. Here’s a breakdown of the core components that transform a simple data sheet into a high-impact strategic document.
Core Components of a High-Impact Client Report
| Component | Purpose | Key Metrics Example |
|---|---|---|
| Executive Summary | Provides a high-level overview of performance, key wins, and next steps for busy stakeholders. | "Q3 saw a 15% increase in MQLs, driven by the new webinar campaign. Key focus for Q4 is converting these leads." |
| Goal & KPI Pacing | Shows progress against the client’s primary business objectives and agreed-upon KPIs. | "We are at 85% of our annual revenue goal with one quarter remaining." |
| Performance Deep Dive | Details the 'what' and 'why' behind the numbers, broken down by channel or campaign. | "Organic traffic grew 22% MoM, largely due to ranking improvements for 'X' and 'Y' keywords." |
| Insights & Analysis | Explains what the data actually means. This is where you connect performance to business impact. | "The higher CPL on LinkedIn was offset by a 50% higher conversion rate, indicating better lead quality." |
| Action Plan & Next Steps | Outlines the strategic plan for the upcoming period based on the report's findings. | "Next month, we will reallocate 20% of the budget from Google Search to LinkedIn to capitalize on higher-quality leads." |
By structuring your reports around these core pillars, you ensure every piece of information serves a purpose, guiding the client from data to decision.
Instead of just showing metrics, a powerful report should:
- Provide Context: Explain why certain numbers went up or down.
- Showcase Wins: Clearly highlight successes and attribute them to your team's strategy.
- Address Challenges: Be upfront about underperforming areas and outline your plan to fix them.
- Outline Next Steps: Give clear, actionable recommendations for the next reporting period.
By focusing on the narrative, you shift the conversation from "What did you do?" to "Look at the progress we're making together." This collaborative tone turns a simple update into a strategic consultation, solidifying your role as an indispensable partner.
Getting agency client reporting right prevents the exact communication breakdowns that lead to churn. It’s your best opportunity to articulate your impact, build unbreakable trust, and turn a common pain point into your biggest competitive advantage.
Build Your Reporting Foundation on Client Goals
A great report starts long before you pull a single data point. The most effective agency reporting isn't about throwing every available metric into a dashboard; it’s about answering one simple question for your client: "Are we hitting the business goals we agreed on?"
Without that solid foundation of mutual understanding, even the slickest dashboard is just noise.
It all begins with a dedicated Reporting Kickoff meeting. This isn't a formality—it's a critical strategy session to align your agency's work with the client's core business objectives. It’s where you ditch assumptions and define what success actually looks like for them, together.
Translating Business Objectives into Measurable KPIs
In that kickoff meeting, your main job is to act as a translator. Clients often talk in broad business outcomes like "grow our market share" or "become an industry leader." Your role is to break those big ambitions down into specific, trackable Key Performance Indicators (KPIs) that your work directly impacts.
For instance, a client's goal of "brand awareness" is way too vague. You need to translate it into marketing metrics you can actually measure and report on.
- Goal: Increase Brand Awareness
- Potential KPIs: Impressions, Reach, Share of Voice (SOV), Branded Search Volume
On the other hand, a goal like "generate high-quality leads" demands a totally different set of metrics focused on efficiency and conversion.
- Goal: Generate High-Quality Leads
- Potential KPIs: Cost Per Lead (CPL), Marketing Qualified Leads (MQLs), Lead-to-Customer Conversion Rate
Getting this right is crucial. Reporting on impressions to a client who’s laser-focused on CPL will create an instant disconnect. They'll feel like you just don't get their business. If you need a refresher, we've got a comprehensive guide to https://www.adstellar.ai/blog/performance-marketing-metrics that covers all the essentials.
The real point of the kickoff meeting is to create a single source of truth for performance. When you and the client both agree on the exact metrics that spell success, every report from then on becomes a clear, straightforward check-in against those benchmarks.
Building this alignment is more important now than ever. Agency-client relationships are under a lot of pressure. A recent report found that over 50.9% of advertising agencies feel their client dynamics are more strained than they were just two years ago, mostly due to clients demanding more transparency and provable results. Nailing down a goal-oriented reporting foundation isn't just a best practice anymore—it's a survival tactic.
Asking the Right Questions to Uncover True Goals
Just asking "What are your goals?" rarely cuts it. You have to dig deeper with questions that get to the heart of what the business actually needs. This helps you filter out the fluff and zero in on the metrics that matter to their bottom line.
Here are a few powerful questions to steer your kickoff session:
- "If you could only look at three metrics to decide if our partnership is a success, what would they be and why?"
- "What does a 'home run' month look like for your business? Give me specific numbers."
- "Which data points do you currently show your own leadership team or board?"
- "If one metric suddenly tanked, which one would cause the most panic?"
These kinds of questions turn a generic marketing chat into a focused business strategy session. The answers you get will dictate the structure, content, and narrative of every single report you build from that point forward.
For example, finding out the client's CEO only really cares about the Customer Acquisition Cost (CAC) to Lifetime Value (LTV) ratio is a game-changer. You now know that metric needs to be front and center in every executive summary you write.
Avoiding the Vanity Metrics Trap
One of the biggest mistakes agencies make is focusing on vanity metrics. These are the numbers—like page likes, follower counts, or raw traffic—that look impressive at a glance but have little to no real connection to business outcomes. While they can be useful for diagnostics, they should never be the headline of your report.
| Metric Type | Example | Why It's a Problem | Better Alternative |
|---|---|---|---|
| Vanity Metric | Page Likes | Doesn't directly correlate to sales or lead quality. A high number of likes from an irrelevant audience is useless. | Engagement Rate, Clicks from Social to Website |
| Vanity Metric | Website Traffic | High traffic is meaningless if it's from the wrong audience and doesn't convert. | Conversion Rate, Cost Per Acquisition (CPA) |
| Actionable Metric | Lead-to-Customer Rate | Directly measures the quality of leads your campaigns are generating and their impact on sales. | N/A |
| Actionable Metric | Return on Ad Spend (ROAS) | Provides a clear, financial measure of campaign profitability and business impact. | N/A |
By grounding your reporting in actionable metrics tied to agreed-upon goals, you turn your reports from a simple activity summary into a strategic document that proves your value. This alignment ensures every chart and data point directly answers the client's most important questions, solidifying your role as a true strategic partner. And as you refine your strategies, keeping up with the latest content marketing best practices will ensure your efforts—and your reports—stay sharp and relevant.
Design an Automated Reporting Workflow That Scales
Alright, you’ve nailed down the client’s goals and have a solid list of KPIs. Now for the fun part: building the engine that will actually power your reporting. This is where we leave behind the tedious, manual grind and build an automated workflow that scales as you grow.
The whole point is to free up your team from the soul-crushing task of pulling data so they can focus on finding the insights that actually matter. We're aiming to build a system that handles 80% of the repetitive work automatically. Think of it as designing a repeatable process—connecting data, creating smart templates, and letting the system do the heavy lifting week after week.
It all starts with that initial client conversation and flows directly into the metrics you'll track.
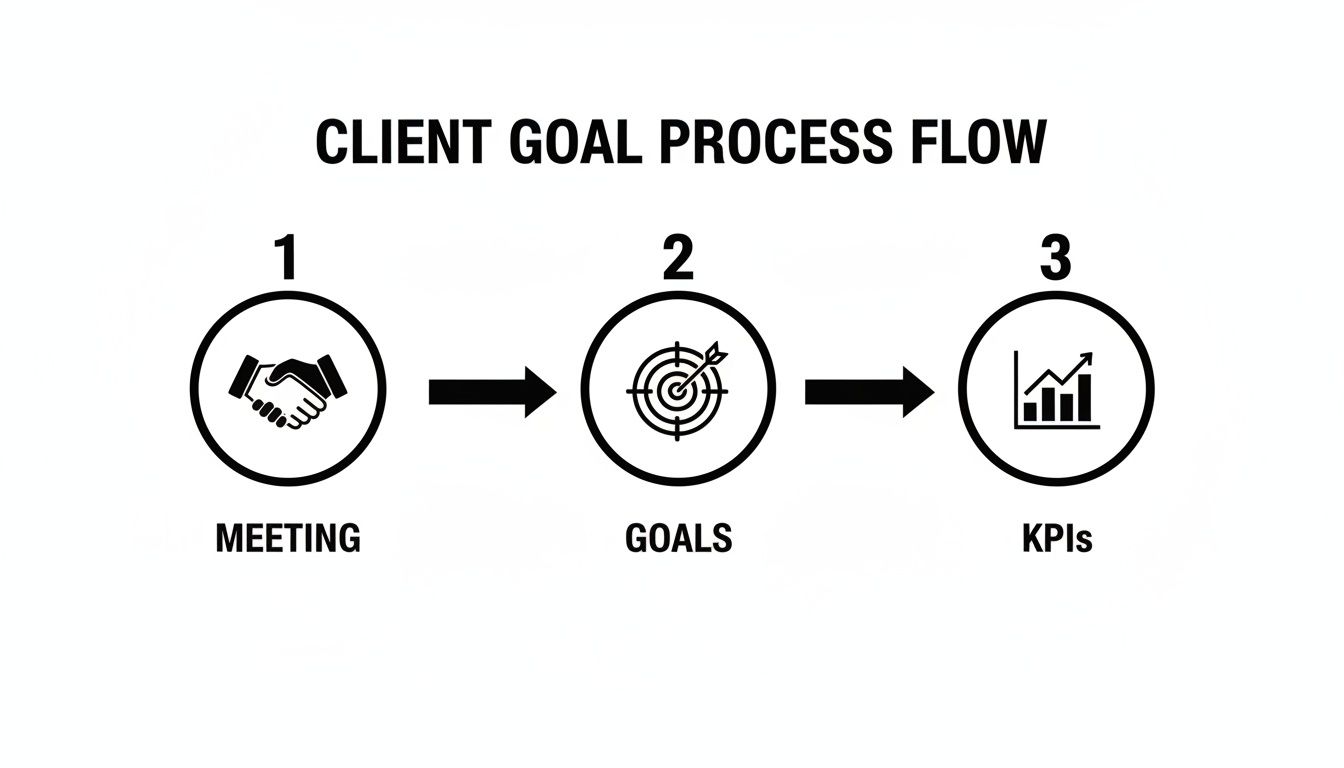
This simple flow is the bedrock of a scalable system. Every piece of data you report on should trace back to that initial alignment.
Connecting Your Data Sources
First things first, you have to get all your data talking to each other. Your client's performance data is probably scattered everywhere—Google Analytics, Meta Ads, LinkedIn Ads, the CRM, you name it. Manually exporting CSVs from each one every week is not just a time-sink; it’s a recipe for costly mistakes.
This is where the concept of ETL (Extract, Transform, Load) comes into play, even if you’re not using a heavy-duty enterprise tool.
- Extract: This is just pulling data directly from the source APIs, like Meta or Google Ads.
- Transform: The raw data gets cleaned up and standardized. For example, you might blend campaign data from different ad platforms into one unified format.
- Load: Finally, all that clean, organized data is pushed into your reporting tool, ready to be visualized.
Fortunately, modern reporting platforms like Looker Studio, Databox, or AgencyAnalytics have built-in connectors that do all the ETL work for you. You just connect your accounts once, and the tool handles the rest, automatically refreshing the data so you don't have to.
Automating data collection is non-negotiable. It wipes out human error and guarantees your reports are built on the most current, accurate information. This is the first and most critical step to building a workflow that can actually keep up with your agency’s growth.
Building Your Master Dashboard Templates
With your data flowing smoothly, it's time to create your master dashboard templates. One of the biggest mistakes I see agencies make is building every client report from scratch. It’s incredibly inefficient and leads to a completely inconsistent client experience.
Instead, build one master template that becomes the starting point for every client.
Your template needs a clear visual hierarchy that tells a story at a glance. I like to structure it like a newspaper: big headlines up top, with more detailed stories below.
A solid dashboard template usually includes:
- The Executive Overview: The very top section should feature the 3-5 most critical KPIs you agreed on in the kickoff. This gives busy stakeholders a high-level snapshot of performance in seconds.
- Performance Deep Dives: Use the sections below to break down performance by channel or campaign. This is where you can show trends over time for key metrics like traffic, conversions, and ROAS.
- Creative and Audience Insights: I always include a section to highlight top-performing ad creatives, headlines, or audience segments. It’s a great way to visually prove your team’s optimization efforts are paying off.
For agencies juggling a ton of Meta ad campaigns, having a standardized dashboard is a lifesaver. If you want to get more granular on specific tools, check out our guide on choosing the right Facebook Ads reporting software to automate this piece of the puzzle.
The Power of Visual Storytelling
Let's be honest: how you present the data is just as important as the data itself. A cluttered, confusing dashboard will get ignored every time. Your template should use visual cues to guide the client’s eye and make the information dead simple to understand.
- Use Trend Lines, Not Just Numbers: Don't just show a single number for "Leads." Show a line chart of leads over the past six months. Context is everything.
- Incorporate Goal Pacing: Many tools let you set goals for specific metrics. A simple gauge chart showing you're 85% of the way to the quarterly lead goal is way more powerful than just stating the current number.
- Color-Code for Clarity: Be consistent with your colors. For example, always use green for positive changes (like a higher conversion rate) and red for negative ones (like a rising CPA).
Setting Up Proactive Alerts
An automated system shouldn't just pull data—it should monitor it, too. A truly scalable workflow includes proactive alerts that flag significant changes, letting you jump on issues before the client even knows they exist.
Set up data anomaly alerts for your most important metrics. For instance, create an alert that triggers if:
- Daily ad spend suddenly tanks by more than 50%, hinting at a billing issue.
- Cost Per Lead (CPL) jumps by over 20% week-over-week, flagging a performance dip.
- A key landing page’s conversion rate flatlines, suggesting a broken form.
These alerts turn your reporting from a passive tool into an active watchdog. It lets your team manage more accounts without dropping the ball, because they’re only pulled in when their expertise is actually needed. This is how you shift from reactive to proactive client management.
Turn Raw Data Into Actionable Insights

You’ve done the hard work. Your automated workflow is pulling data perfectly, the dashboards look slick, and all the numbers are right where they should be. But let’s be honest—an automated report packed with metrics is still just a collection of numbers. It’s not strategic guidance.
This is the exact moment where top-tier agencies leave everyone else behind. They don't just hand over data; they deliver clarity. Your real value isn't in the charts and graphs, but in your ability to translate those raw data points into a compelling story that answers your client’s biggest questions and tells them what to do next.
This step transforms your client reporting from a simple data dump into a strategic consultation, something clients will actually look forward to getting.
Find the Story Within the Numbers
Your client doesn’t have the time or expertise to dig through every table and chart. They’re counting on you to connect the dots and tell them what the data actually means for their business. This means you have to go beyond surface-level observations and figure out the "why" behind the "what."
Start by hunting for patterns, anomalies, and trends. A single data point rarely tells the whole story without some context.
- Trend Analysis: How has performance shifted over the last 3, 6, or 12 months? A 10% dip in conversion rate this month might look bad in isolation. But if you see the same seasonal dip for the last two years, it’s a predictable fluctuation, not a five-alarm fire.
- Segmentation: Never just look at the overall performance. The real gold is usually hidden in the segments. Which audience is secretly driving the highest ROAS? Which ad creative has the lowest Cost Per Acquisition (CPA)?
- Correlation vs. Causation: Did that big spike in organic traffic just happen to coincide with your new PR campaign launch? While you can’t always prove causation, pointing out strong correlations helps show the combined impact of all your marketing efforts.
Imagine you spot a CPA for a specific ad creative that has dropped by 30% in the last two weeks, while its click-through rate has skyrocketed. That’s not just data—that's a story. It’s a loud and clear signal that this creative is hitting the mark with your audience, giving you a data-backed reason to push more budget its way.
Craft a Killer Executive Summary
The executive summary is, without a doubt, the most important part of your report. It's the one section you can guarantee every single stakeholder will read, from your day-to-day contact all the way up to the CEO. It has to be short, sharp, and powerful.
A weak summary just rehashes the numbers. A strong one tells a strategic story. The easiest way to nail this is by structuring it around three simple but potent questions.
What happened? Why did it happen? What should we do next?
This framework forces you to go from just observing to actually analyzing and then recommending action. It’s a simple structure that packs a huge punch.
Here’s what that looks like in practice:
- What happened? "This month, we generated 150 MQLs, which beat our goal of 120. However, our CPL also went up by 12% to $56."
- Why did it happen? "The CPL increase came from expanding into a more competitive, high-intent audience on LinkedIn. While it cost more, these leads had a 25% higher qualification rate."
- What should we do next? "We recommend we keep investing in this LinkedIn audience, but next month we’ll test new ad creatives to bring the CPL down without sacrificing lead quality."
This approach immediately gives the client context and a clear plan, showing off your strategic value. For a deeper dive into this, our guide on building an effective Facebook Ads report has more detailed examples.
Practical Frameworks for Deeper Analysis
To consistently pull out high-quality insights, it helps to have a few go-to analytical frameworks in your back pocket. These aren't complicated theories, just practical ways to interrogate your data and find those meaningful stories.
I find that keeping a simple table of go-to analysis methods helps my team stay focused on what matters. Here are a few of the most effective ones we use regularly.
| Analysis Framework | Core Question | Real-World Application |
|---|---|---|
| Comparative Analysis | How did this month's performance compare to last month or the same month last year? | "Our email campaign's open rate was 5% lower than last month but 15% higher than this time last year, indicating strong year-over-year list health despite a slight monthly dip." |
| Channel Performance Breakdown | Which channels are driving the most efficient results against our primary KPI? | "While Google Ads drove the highest volume of traffic, Organic Search delivered a 40% lower CPA, suggesting an opportunity to scale our SEO content efforts." |
| Funnel Drop-off Analysis | Where are we losing the most potential customers in the conversion path? | "We observed a significant 60% drop-off between 'Add to Cart' and 'Initiate Checkout,' pointing to a potential issue with shipping costs or account creation friction." |
Using frameworks like these helps you graduate from simply reporting numbers to delivering true strategic counsel. Ultimately, the whole point of turning raw data into insights is to enable better data-driven decision making for your clients. Each report should arm them with the confidence and clarity they need to make smarter business moves, cementing your role as their indispensable partner.
Master the Client Presentation and Feedback Loop
So you've built the perfect report. The final step isn’t just hitting "send" on an email—it’s delivering that report with confidence. This is your chance to transform a one-way update into a genuine, two-way strategic conversation.
Even the most beautiful dashboard will fall flat if the presentation doesn’t connect. This is where you graduate from being just another service provider to becoming a true partner. The goal is to present your data in a way that sparks collaboration, builds trust, and actively seeks feedback to make everything better next time.
Structuring the Perfect Reporting Call
The flow of your reporting meeting is just as critical as the data inside the report. A disorganized presentation can easily get sidetracked, leaving your client confused or, even worse, focused on the wrong things. A clear, logical structure keeps the conversation on track and zeroed in on what truly matters.
Always start with the big picture before you even think about diving into channel-specific metrics. Lead with the executive summary and spotlight the biggest wins right off the bat. This immediately sets a positive and productive tone for the rest of the call.
Here’s a simple but incredibly effective agenda I’ve used for years:
- Start with the Wins: Kick things off by celebrating the key successes from the reporting period. This instantly reinforces your value and frames the entire conversation around positive momentum.
- Review Core KPIs: Walk through the main goals you both agreed on in the kickoff meeting. Show the progress against those specific targets to keep the conversation tied directly to business outcomes.
- Dive into the "Why": This is where you shift from what happened to why it happened. Tell the story behind the numbers, clearly connecting your team's actions to the results they see on the screen.
- Outline What’s Next: End with a clear, actionable plan for the upcoming month or quarter. This demonstrates you're always thinking ahead and using the data to make smart adjustments.
Handling Tough Questions and Bad News
Let's be real—not every report will be filled with record-breaking results. Sooner or later, you'll have to discuss a performance dip, a missed target, or a campaign that just didn't land. How you handle these moments is what defines the strength of your client relationship.
The key is to own it completely. Never try to hide or downplay poor performance. Address it head-on, with total transparency, and come prepared with a clear plan of action.
When you have to deliver bad news, frame it as a strategic learning opportunity. Explain what you've discovered from the underperformance and how you're using that insight to get back on track. This builds immense trust and shows you’re a proactive problem-solver, not just a reporter of facts.
If a client throws a tough question at you that you don't have an immediate answer for, don't guess. The best response is a confident, "That's a great question. Let me dig into the data on that and get back to you with a detailed answer." This shows you're thorough and committed to accuracy, not just saying what you think they want to hear.
Creating a Powerful Feedback Loop
The presentation shouldn't be the end of the line; it should kick off an ongoing feedback loop. A report is only valuable if it’s giving the client what they need. If it isn't, you need to know so you can fix it.
Make it a habit to end every reporting call by asking a few simple questions to get feedback on the report itself. This simple step can turn your reporting from a static deliverable into an evolving, collaborative tool.
Here are a few questions I like to ask:
- "Is this report giving you the clarity you need to see our impact?"
- "Was there any metric you were hoping to see that we didn't include?"
- "Is there anything in this format that we could make easier for you to digest?"
These questions do more than just improve your reports. They prove to the client that you genuinely care about providing them with real value, which strengthens the partnership more than any chart or graph ever could. For example, understanding how your work fits into their larger financial goals is crucial. If you need a refresher, you can learn more about how to calculate marketing ROI in our article for a deeper dive.
By mastering the presentation and actively seeking feedback, you turn a routine process into a cornerstone of client retention. It proves you're not just managing their campaigns—you're genuinely invested in their success.
Your Client Reporting Questions, Answered
Even with the slickest process, reporting questions are inevitable. Client reporting has a lot of moving parts, so it's smart to stay on top of best practices and be ready for common roadblocks. I've pulled together some of the most common questions we hear from other agencies to help you sharpen your approach.
How Often Should I Send Reports to Clients?
There’s no magic number here—it all comes down to the client's needs and how fast your campaigns are moving. The right cadence is the one that keeps them in the loop without drowning them in data.
Common schedules we see work well are:
- Weekly: This is for your fast-and-furious campaigns, like a new product launch where performance can swing daily. These are usually quick, dashboard-focused updates.
- Bi-Weekly: A fantastic middle ground. It gives you enough time to spot real trends but keeps the client updated regularly.
- Monthly: This is the industry standard for a reason. It offers a complete picture of what happened, what we learned, and what we’re doing next month.
- Quarterly: Save this for the big picture. These meetings are all about high-level strategy, progress against major business goals, and planning for the next three months.
The easiest way to solve this? Just ask them. During kickoff, find out what cadence makes them feel informed, not overwhelmed.
What Is the Best Tool for Client Reporting?
The best tool is whichever one plugs into your workflow, fits your budget, and doesn't make your team want to pull their hair out. Big names like Looker Studio, Databox, and AgencyAnalytics are popular for a good reason—they do the heavy lifting of pulling data together automatically.
Your top priority should be integrations. Find a tool that connects to every single one of your data sources, from Meta Ads to Google Analytics. A platform that automates 80% of your data pulling is nice, but one that gets you to 100% is how you actually scale. It's less about the logo and more about how much manual grunt work it kills.
Your reporting tool has one main job: to buy your team's time back. If you're looking at a platform that still needs hours of manual CSV downloads and data cleanup, walk away. The entire point is automation so your experts can focus on analysis and strategy—that's what clients pay for.
How Do I Report on Bad News or Poor Performance?
You get in front of it. Fast. Never, ever let a client discover a significant problem in a scheduled report.
The moment you spot a real issue, you need to communicate it with total transparency. When you do present the numbers, frame the entire situation as a learning opportunity. Explain your hypothesis for the performance dip, what you've learned from it, and—most importantly—present a clear, actionable plan to get things back on track.
This proactive honesty does more to build trust than a dozen perfect reports ever could. It shows you're a strategic partner who owns the outcomes, not just a vendor sending updates. We actually dig deeper into the challenges of presenting complex data clearly in our article on Meta Ads reporting complexity.
Ready to stop wrestling with spreadsheets and start scaling your Meta ad campaigns with powerful, AI-driven insights? AdStellar AI automates bulk ad creation, identifies winning combinations, and helps you launch campaigns 10x faster. Discover how AdStellar AI can transform your workflow and boost your ROAS.