Ever heard that you need to spend money to make money? In advertising, that starts with getting your brand seen. The cost for each of those views—even the fleeting ones—is your cost per impression.
For many advertisers, especially on platforms like Meta, this cost can be incredibly low, sometimes just $0.005 to $0.007 for a single ad view. It's one of the most efficient ways to get your brand in front of a massive audience, and understanding it is the first step to truly owning your ad budget.
What Is Cost Per Impression and Why Does It Matter?

Picture your ad on a giant digital billboard in the middle of a busy city square. Every single person who walks by and lays eyes on it counts as an impression. The cost per impression (CPI) is what you pay for each of those individual glances. It doesn't matter if they stop and stare or just catch it out of the corner of their eye—you're paying for the visibility.
This metric is the bedrock of ad reach. It cuts through the noise and tells you one simple thing: how much it costs to get a pair of eyeballs on your ad. Unlike metrics that track clicks or conversions, CPI is all about exposure. For performance marketers trying to scale their campaigns, especially on platforms like Meta, this isn't just nice-to-know information; it's essential.
Meet CPM: Your Metric's Close Relative
Now, you’ll almost always hear this discussed as CPM, which stands for Cost Per Mille (Mille is just Latin for "thousand"). Ad platforms didn't invent this term to confuse you; it's just much cleaner to talk about paying $7.00 per 1,000 impressions instead of $0.007 for a single one.
The relationship is simple: CPM is the price for 1,000 views, while CPI is the price for one. Getting comfortable with both helps you zoom in and out on your ad spend, giving you a powerful grip on your budget from every angle.
If you want to get a better handle on this foundational concept, check out our guide on what impressions on social media truly mean. It sets the stage perfectly for what comes next: calculating and crushing your costs.
To give you a quick lay of the land, here’s a look at what you can generally expect to pay for impressions across different channels.
Quick Guide to Typical Cost Per Impression (CPI) Ranges
This table offers a bird's-eye view of what a single impression might cost you on some of the most common advertising platforms. Think of it as a quick benchmark to see if your own costs are in the right ballpark.
| Advertising Channel | Typical CPI Range | Best For |
|---|---|---|
| Meta (Facebook & Instagram) | $0.006 - $0.015 | Broad audience reach, D2C, and e-commerce |
| Google Display Network | $0.005 - $0.010 | Retargeting and brand awareness campaigns |
| LinkedIn Ads | $0.060 - $0.080 | B2B lead generation and professional audiences |
| Traditional TV | $0.030 - $0.075+ | Mass-market brand building and awareness |
Keep in mind, these are just typical ranges. Your actual costs will swing based on your industry, audience, and a whole lot of other factors we'll dive into.
How to Calculate Your Average Cost Per Impression
Figuring out your average cost per impression is surprisingly simple, yet it's the first step to understanding how much reach you're really getting for your ad spend. There's no fancy math involved, just a quick calculation that tells you a lot about your campaign's efficiency.
The formula is as straightforward as it gets. You just take the total amount of money you spent on a campaign and divide it by the number of times your ad was shown.
Total Ad Spend / Total Impressions = Average Cost Per Impression (CPI)
This little bit of math gives you the price you paid for a single view of your ad. It's the most basic way to see if you're paying a fair price for visibility. To get a better handle on the different performance marketing metrics and how they all fit together, let's see this formula in action.
Putting the Formula to Work
Let's walk through a few real-world scenarios to see how this plays out for different businesses and budgets.
Example 1: A Small E-commerce Brand An online boutique spends $500 on a Meta campaign to show off a new product. That campaign racks up 80,000 impressions.
- Calculation: $500 / 80,000 = $0.00625
- Their average cost per impression works out to just over half a cent.
Example 2: A B2B SaaS Company A software company dips its toes into display ads, spending $2,000 to get in front of professionals on industry-specific websites. Their ads are shown 150,000 times.
- Calculation: $2,000 / 150,000 = $0.0133
- Their CPI is about $0.013, a bit higher because they're targeting a more specific—and valuable—audience.
Example 3: A Large-Scale Agency Campaign An agency is running a $50,000 campaign for a national retailer, generating a massive 5,000,000 impressions across a bunch of different platforms.
- Calculation: $50,000 / 5,000,000 = $0.01
- The average CPI across their entire multi-channel push is exactly one cent.
Connecting CPI to CPM
You’ve probably seen costs reported as CPM (Cost Per Mille), which is just the cost per one thousand impressions. It's the industry standard, so knowing how to switch between CPI and CPM is crucial for reading reports from any ad platform.
The conversion is easy: CPI = CPM / 1000. So, if your dashboard shows a $12.00 CPM, your CPI is $0.012. This quick conversion ensures you can always drill down to the cost of a single eyeball on your ad, no matter how the platform presents the data.
Cost Per Impression Benchmarks Across Channels
So you know how to calculate your average cost per impression. The next logical question is, "Is my number any good?"
Knowing your CPI is one thing, but understanding how it stacks up against the market is where the real strategy begins. The price of an impression isn't a flat rate; it swings wildly depending on where you're buying your ad space. Getting a handle on these differences is absolutely critical for building a smart, efficient media plan.
Digital channels, especially social media, have completely rewritten the rules for cost-effective reach. On platforms like Meta (think Facebook and Instagram), the average cost per thousand impressions (CPM) often hangs out in the single digits. That breaks down to an incredibly low cost for a single impression—often less than a penny.
The Digital Advantage
The sheer efficiency of digital platforms is a game-changer for anyone focused on performance. For example, recent data from late 2024 shows the average social media CPM was $5.69. Do the math, and that works out to a CPI of just $0.00569.
This kind of affordability lets brands get in front of huge audiences without a Hollywood-sized budget. It makes digital the perfect playground for testing new ideas, learning what works, and scaling your winners. You can take a closer look at the costs of advertising online to see how different platforms stack up.
This chart breaks down the simple but powerful relationship between your ad spend, the impressions you generate, and your resulting CPI.
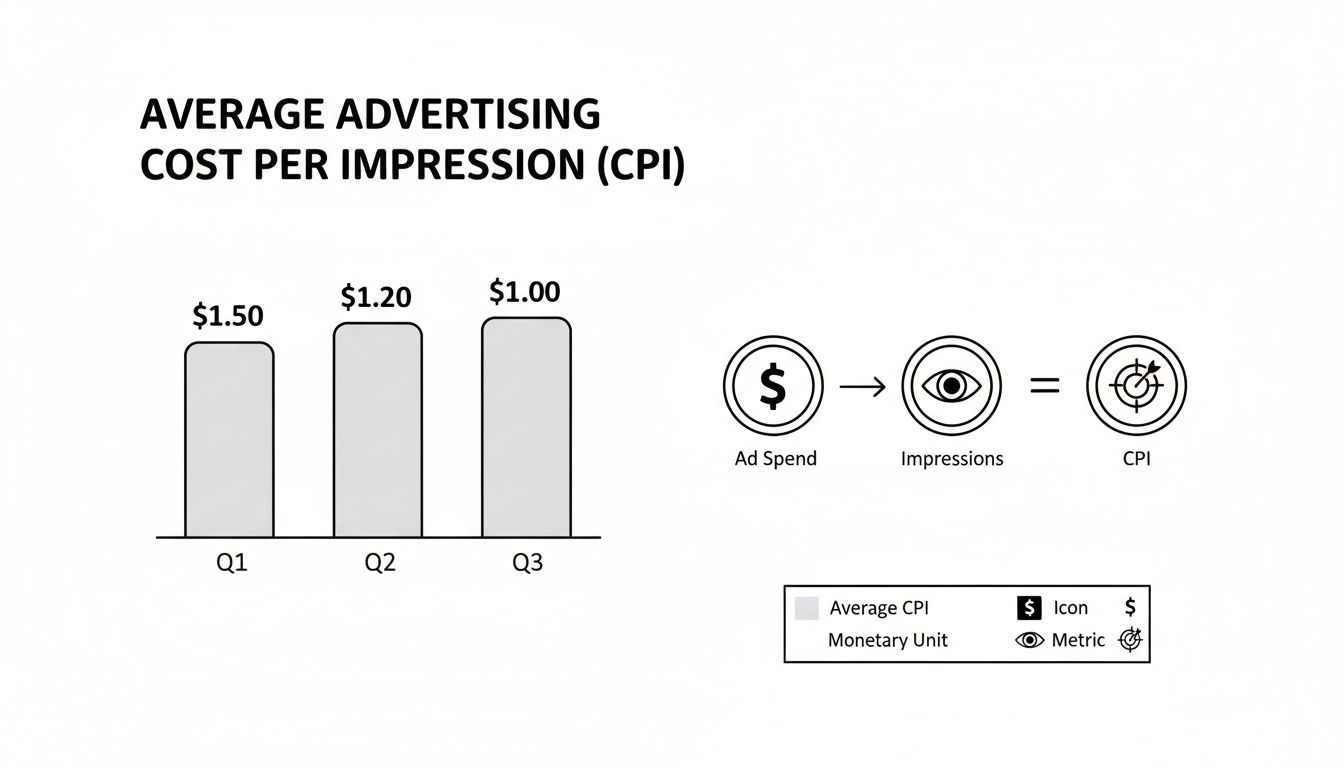
As you can see, getting more eyeballs (impressions) for the same amount of money pushes your CPI down, making every dollar you spend work harder.
The Traditional Media Contrast
Now, let's flip the coin and look at traditional media. Channels like broadcast television are still titans for building mass-market brand awareness, but they play in a completely different financial league. The barrier to entry is much higher, and so is the price tag for every single impression.
Media inflation since the pandemic has pushed TV advertising costs to historic highs. Global TV CPMs shot up by a staggering 31.2% since 2019. In the US market, that meant costs climbed as high as $73.14 per thousand impressions by 2022.
That works out to an average CPI of over $0.073—more than ten times what you might pay for a comparable impression on social media.
Average Cost Per Impression (CPI) Channel Comparison
To put it all into perspective, here’s a look at how different channels compare when it comes to the cost of getting your ad seen. This table highlights just how varied the advertising world is, from ultra-efficient digital platforms to high-impact traditional media.
| Channel | Average CPI (Approximate) | Primary Use Case | Source Highlight |
|---|---|---|---|
| Social Media (Meta) | $0.005 - $0.008 | Targeted reach, direct response, community building | Unbeatable for granular targeting at a low cost. |
| Search (Google Ads) | $0.01 - $0.05 | High-intent audience capture, lead generation | Higher cost, but captures users actively looking for solutions. |
| Display Advertising | $0.001 - $0.004 | Broad brand awareness, retargeting | The most affordable impressions, but often lower engagement. |
| Linear TV | $0.03 - $0.08+ | Mass market reach, brand storytelling | The gold standard for broad awareness, but at a premium price. |
| Streaming/Connected TV | $0.02 - $0.05 | Targeted household reach, brand building | Blends TV's impact with some of digital's targeting capabilities. |
This comparison makes it clear: if your goal is efficient, scalable reach, digital channels offer a massive advantage that's hard for traditional media to match.
For marketers who live and die by performance metrics, the math is crystal clear. Digital channels provide a level of cost efficiency and targeting precision that traditional media just can't touch. This is exactly why platforms like Meta continue to be a cornerstone for growth teams trying to reach more people without breaking the bank.
To stay on top of these evolving benchmarks, it's always a good idea to tune into what the experts are saying. For example, the annual insights from performance marketing shows are a great source for up-to-the-minute data on how different channels are performing. The gap between digital and traditional costs just keeps getting wider, reinforcing why mastering impression-based advertising online is no longer optional—it's essential.
What Really Drives Your Impression Costs?
Figuring out your average cost per impression is a good start, but the real power comes from understanding why that number goes up and down. Think of the ad auction as a massive, live marketplace. The price you pay for visibility isn't fixed; it's constantly shifting based on a few key levers.
One of the biggest factors is your audience targeting. Are you trying to reach a massive group like "all fitness enthusiasts in North America," or are you zeroing in on a super-specific niche like "marathon runners in Boston training for their next race"? The tighter and more valuable your audience, the more advertisers will be clamoring for their attention. That competition naturally drives up the price for every single impression.
Simply put, a high-demand audience costs more to reach. The trick is to find that sweet spot between laser-focused precision and a cost that doesn't blow your budget. This is where mastering audience segmentation strategies can give you a massive competitive advantage.
Where and When You Advertise Matters
The digital real estate you choose to buy plays a huge role in your costs. An ad placed front-and-center in the main Meta Feed is going to have a different price tag than one tucked away in Instagram Stories or the Audience Network. Some placements are just more premium and crowded, which leads to a higher average cost per impression.
Then there's seasonality. This one can cause some seriously dramatic swings in your costs. Trying to advertise during peak season, like Black Friday or Cyber Monday, is like trying to get a ride-share during a downpour at rush hour—demand is sky-high, and so are the prices. On the flip side, running ads in a quieter month like January can often land you much lower impression costs as the competition takes a breather.
Competition and Creative Quality
Finally, two powerful forces are always at play: how crowded your industry is and how good your ad actually is.
- Industry Competition: If you're in a cutthroat market like e-commerce fashion or B2B SaaS, you’re simply going to have more advertisers bidding for the same eyeballs. More bidders means higher costs.
- Creative Quality: Ad platforms want to show people things they actually like. They reward high-quality, engaging ads with better visibility at a lower cost. A killer video or a stunning graphic with a high relevance score signals to the platform that users are connecting with your ad. In contrast, a boring, irrelevant ad gets penalized with higher impression costs to make up for its poor performance.
By getting a handle on how your audience, placement, timing, and creative quality all interact, you can stop guessing and start diagnosing exactly why your costs are what they are. That's the first step to finding clear opportunities to optimize your spend.
Actionable Strategies to Lower Your Cost Per Impression
Knowing what drives your costs is one thing, but actually taking control is where the real work begins. Lowering your average cost per impression isn’t about pinching pennies or gutting your budget; it’s about making every single dollar pull its weight.
The goal is to systematically test and tweak the key parts of your campaign to find those sweet spots of efficiency. This is your playbook for turning data into real savings. The core idea is simple: find what works, then do more of it. But that requires a genuine commitment to continuous, data-driven experimentation.
Fine-Tune Your Audience Targeting
The fastest way to burn through your budget is to show your ads to the wrong people or to fight for attention in an overly crowded audience segment. Your mission is to find those less competitive pockets of users who are still a perfect match for your brand.
Explore Lookalike Audiences: Instead of just targeting broad interests, try creating lookalike audiences from your best customers—think people with a high lifetime value or recent purchasers. This tactic often uncovers high-intent users your competitors are completely ignoring.
Layer Your Targeting: Don't just pick one interest and call it a day. Get specific by combining different targeting criteria. For example, instead of targeting "running enthusiasts," narrow it down to users who are interested in running and have recently purchased athletic apparel online.
By refining who sees your ads, you cut down on waste and focus your spending on impressions that are far more likely to mean something. That precision is a direct line to a lower, more efficient average cost per impression.
A/B Test Your Ad Creatives and Copy
Your ad creative is the single biggest lever you can pull to influence your costs. Platforms like Meta actually reward engaging ads with lower costs because they create a better experience for their users. This means you have to be testing constantly to find the images, videos, and messages that truly connect.
A solid testing plan is non-negotiable if you're serious about getting that average cost per impression down. You're on a hunt for the top-performing combinations of visuals and text that stop the scroll and get people to act.
Here’s a simple way to structure your tests:
Isolate Variables: Test just one thing at a time. You could start with radically different images or videos to see which style gets the best reaction. Once you have a winner, move on to testing headlines, and then the body copy.
Test Ad Formats: Don't get stuck in a rut with single images. Pit them against carousels, videos, and Reels. You'll often find that performance and costs can swing wildly from one format to another.
Analyze and Iterate: When you find a clear winner, that ad becomes your new "control" creative. The next step is to start testing new variations against it. This cycle of continuous optimization is what keeps your costs low over the long haul.
Let AdStellar AI Handle the Heavy Lifting
Trying to manually tweak all the little things that affect your average cost per impression is a massive headache. It means non-stop testing, digging through data, and making endless adjustments—a cycle that can burn out even the most dedicated marketing teams. This is exactly where platforms like AdStellar AI come in, turning a complex, hands-on job into an automated, data-backed workflow.
Instead of getting bogged down setting up one ad variation at a time, you can use AdStellar's bulk creation tools to launch hundreds of different creative, copy, and audience combos in minutes. This kind of rapid-fire experimentation is the secret to quickly uncovering which specific ad sets give you the lowest cost for your impressions.
AI That Finds Your Winners for You
But the platform does more than just help you test faster; it takes the guesswork out of figuring out what actually worked. The AI Insights module automatically pinpoints and ranks your best-performing assets—from creatives to audiences—based on the goals you care about most, whether that's ROAS or CPA.
AdStellar's system is built to create a constant feedback loop. It learns from every single dollar you spend, making sure the next one works even harder to systematically lower your average cost per impression over time.
This dashboard gives you a glimpse of how AdStellar lays out performance data, making it incredibly easy to see which combinations are hitting the mark.

By putting your top performers front and center, the platform helps you double down on what’s working without getting lost in a sea of spreadsheets.
This level of automation is especially critical right now. Recent data shows the average social media CPM dipped to $5.69 in late 2024, which works out to just $0.0057 per impression. That makes platforms like Meta incredibly competitive, and having an AI tool in your corner is essential to capture that value at scale. You can find more details on global advertising trends over at datareportal.com.
AdStellar then takes this performance data and feeds it directly into its AI Launch and auto-learning models. These tools build out brand new campaigns using your proven winners and automatically scale the ads that are performing best as fresh data rolls in. You can learn more about how AdStellar’s AI optimization features can completely change how you manage your campaigns.
Got Questions? We’ve Got Answers.
Even after you've got the basics down, you're bound to have some questions about the finer points of managing your average cost per impression. Here are some straightforward answers to the questions we hear most often.
Is a Super Low Cost Per Impression Always a Good Thing?
Not always. While a low CPI feels like a win—you’re getting more eyeballs for less money—you have to ask, whose eyeballs are you getting? If you score a rock-bottom CPI by blasting your ads out to a totally irrelevant audience, those views are just noise. They’ll never turn into customers.
The real goal is to find the lowest possible CPI within your ideal, high-intent audience. Always measure your impression costs against bottom-line metrics that actually matter, like Cost Per Acquisition (CPA) and Return on Ad Spend (ROAS). That’s how you know your ads aren't just cheap, but genuinely effective.
An extremely low CPI can sometimes be a red flag. It might mean your targeting is way too broad or you're reaching a low-quality audience. Aim for efficiency, not just the absolute lowest number on the screen.
What’s the Difference Between CPM and CPI?
This one trips people up, but it’s simpler than it sounds. CPM stands for Cost Per Mille, which is just a fancy way of saying cost per thousand impressions. CPI, or Cost Per Impression, is the cost for a single view. They’re measuring the exact same thing, just at a different scale.
Think of it like this: CPI = CPM / 1000. So, if your Meta Ads dashboard shows a CPM of $8.00, the cost for one impression (your CPI) is just $0.008. Ad platforms use CPM because dealing with whole numbers like $8.00 is much cleaner than tiny decimals. But knowing your CPI is crucial when you want to dig into the details.
How Often Should I Be Checking My Cost Per Impression?
When you’ve just launched a campaign, it’s smart to check your CPI daily. This is especially true during the initial learning phase or when you're testing new creative and audiences. Daily check-ins let you spot expensive ads quickly and move your budget to what’s working.
For campaigns that have been running for a while and are stable, a weekly check-in is usually enough to keep an eye on trends. But always pay attention to the context. A sudden spike in CPI could signal a new competitor, a change in your audience’s behavior, or even an algorithm update on the platform. Staying on top of it helps you stay ahead of the game.
Ready to stop guessing and start winning? AdStellar AI takes the manual work out of finding your lowest possible cost per impression. It rapidly tests hundreds of ad variations and automatically scales the winners for you. See how you can slash your costs and send your ROAS soaring by visiting AdStellar.ai.