
You're looking at a laptop with too many tabs open, and none of them agree. One dashboard says the campaign is scaling, another says checkout is leaking, and a third says the best product is the one your team nearly paused yesterday. That's the state of digital commerce analytics for many teams right now, it's not a reporting layer anymore, it's the system that decides what to keep, what to cut, and what to test next.
In 2026, that pressure is bigger because ecommerce itself is bigger. Global retail ecommerce sales were estimated at $6.42 trillion in 2025 and are projected to reach $6.88 trillion in 2026, up from $3.3 trillion in 2019 (inriver). One industry estimate also places the global ecommerce analytics market at $22.4 billion in 2025, with growth projected to $58.1 billion by 2033 at a 12.6% CAGR (inriver). That's why every media buyer, merchandiser, and retention manager ends up asking the same question, not “what happened?” but “what should we change today?”
Why Digital Commerce Analytics Now Runs the Whole Growth Function
A media buyer can open 14 dashboards and still not know what to turn off. The creative looks strong, Meta shows healthy spend, Google Analytics shows traffic, Shopify shows sales, and email reports tell a different story again. Without a shared analytics layer, each team defends its own version of the truth, and budget decisions get made by whoever can explain the numbers fastest.

The shift happened because ecommerce stopped being a side channel and became a multi-trillion-dollar operating environment. When sales volumes are this large, a small tracking gap can distort the picture across acquisition, retention, and merchandising. That's why teams now treat analytics as the control layer for spend, not a post-campaign report.
What changes when analytics becomes the operating system
Once a team has a unified view, creative decisions get sharper. If a top-performing ad drives traffic that bounces early, the issue isn't the ad alone, it's the promise-to-page mismatch. If a product page attracts clicks but the cart step leaks, the next move isn't more media, it's fixing the offer, the UX, or the checkout flow.
The point of digital commerce analytics is not to admire charts. It's to decide whether to scale, pause, reposition, or rebuild. That same logic is why automation workflows matter, too, because the more sources you connect, the more valuable it is to route decisions into a repeatable system like digital marketing automation.
Practical rule: if a dashboard can't tell you which lever to pull, it's reporting, not analytics.
Great creative strategy still matters, but without a reliable analytics layer, even the best idea gets judged through incomplete data. The teams that win are the ones that connect measurement to action before they scale spend.
The Core Vocabulary Every Analyst and Buyer Must Share
The fastest way to create friction between growth teams and data teams is to use the same word for different things. In ecommerce reporting, metrics are numeric measures, while dimensions are the labels you use to group them. Shopify's reporting model makes that distinction explicit, because the difference between a number and a grouping field determines whether you can answer “what changed?” or “where did it change?” (Shopify analytics fields).
That matters in day-to-day work. Conversion rate is a metric. Traffic source, product title, and day are dimensions. If a buyer asks for conversion rate by source, they're really asking for the metric broken out by a dimension. If they can't say that clearly, the report usually comes back unreadable.
The KPI language that keeps teams aligned
Use a small core vocabulary and define it the same way every time. Revenue tells you what came in, AOV tells you how much each order is worth on average, conversion rate shows how efficiently sessions turn into orders, LTV shows how much value a customer brings over time, churn shows who leaves, and cohort behavior shows how different customer groups perform over time. These aren't just finance terms, they're decision terms.
Working rule: one KPI should always point to one decision owner. If nobody knows who acts on it, it doesn't belong on the main dashboard.
| Essential Digital Commerce KPIs at a Glance | Formula | Primary Decision | Common Failure Mode |
|---|---|---|---|
| Revenue | Orders × order value | Budget allocation | Looks healthy while margin erodes |
| AOV | Total revenue ÷ number of orders | Bundles, upsells, pricing tests | Rises while conversion drops |
| Conversion rate | Orders ÷ sessions | Landing page and offer changes | Hides traffic quality problems |
| LTV | Value from a customer over time | CAC ceiling and retention spend | Overstated when returns are ignored |
| Churn | Customers lost ÷ starting customers | Retention offers and winback timing | Misread when cohorts are mixed |
| Cohort behavior | Performance by acquisition group over time | Channel, message, and product strategy | Averaged away in blended reporting |
If bounce is part of your funnel diagnosis, a practical explainer like how to lower bounce rate can help teams connect page experience to acquisition efficiency without overcomplicating the math.
Once the team shares this language, dashboards stop being argument generators and start becoming decision tools. That's also where campaign taxonomy matters, because if naming and tagging are sloppy, every later analysis gets fuzzy. A clean setup for UTM tracking keeps source data usable when the team needs to compare channels, creatives, and landing pages side by side.
A High-Signal KPI Chain That Connects Acquisition to Margin
Treat traffic source, conversion rate, ROAS, revenue per visitor, cart abandonment, and SKU performance as one chain, not six separate KPIs. Each one explains the next failure point. If you only read them independently, you end up fixing the wrong part of the funnel.
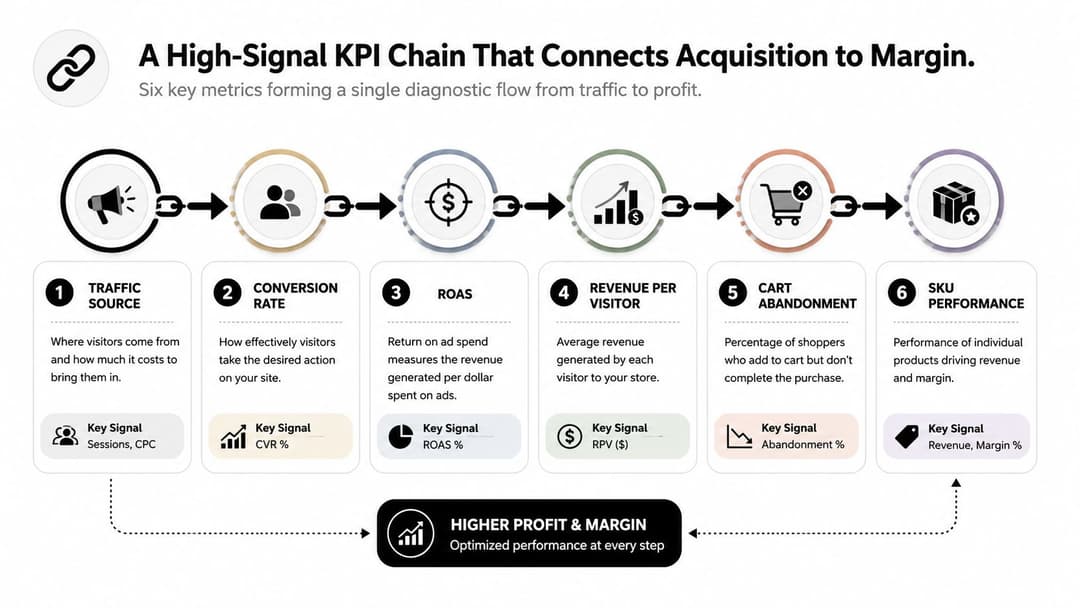
A slow landing page is the easiest way to see the chain in action. The ad wins the click, but the page loads badly, bounce rises, add-to-cart falls, revenue per visitor drops, and ROAS collapses even though the creative itself looked strong. The issue isn't just media quality, it's the handoff between promise and experience.
Read the chain from left to right
Start with traffic source. It tells you whether the session came from paid social, search, email, referral, or direct, which immediately changes the creative and bidding question. If a source brings volume but weak downstream behavior, the fix may be audience selection, message match, or bid strategy, not budget expansion.
Then look at conversion rate and revenue per visitor together. Conversion rate tells you whether the site persuades, while revenue per visitor shows whether that persuasion is worth enough to justify the spend. If conversion rises but RPV stays flat, the team may be selling lower-value items or attracting low-intent traffic.
Cart abandonment tells a different story. A high abandonment rate means the problem has moved from product interest into checkout friction, payment trust, or hidden costs. That's why abandonment and SKU performance belong in the same review, because the product mix can influence both margin and the likelihood of purchase completion.
For campaign operators, this chain is the bridge back into campaign performance metrics. It keeps the team from celebrating CTR or top-line ROAS while the actual order quality declines.
If the first three metrics look good and the last three look bad, don't add more spend. Find the handoff that broke.
The practical habit is to map each metric to one action. Traffic source changes bids or audience rules. Conversion rate changes page or offer tests. ROAS changes budget allocation. Revenue per visitor changes product mix and bundle strategy. Cart abandonment changes checkout work. SKU performance changes merchandising and creative selection.
Instrumentation Foundations That Make Everything Else Trustworthy
If the tracking layer is shaky, every downstream insight gets noisy. The most common failure isn't a bad dashboard, it's inconsistent event design, browser-level tracking loss, and disconnected customer identifiers. Teams then argue about attribution when the core issue is that the data never arrived cleanly.
A solid setup starts with event taxonomy. That means every key action, such as view item, add to cart, begin checkout, purchase, and refund, has one agreed name and one agreed meaning. Without that consistency, the same event gets logged three different ways across analytics tools, and comparisons stop making sense.
Build redundancy into the tracking stack
Browser tracking alone is fragile. Ad blockers, privacy settings, and browser restrictions can interrupt it before the event ever reaches your report. That's why many teams now pair browser tracking with server-side events, plus Meta Pixel and Conversions API, so the platform still receives purchase signals when client-side tracking fails.
GA4 belongs in the stack too, but it shouldn't sit alone. It's useful for cross-platform event analysis, yet the more serious the business gets, the more it needs a unified customer data layer that ties sessions, orders, and CRM records together. That's what lets analysts compare channel quality, not just channel volume.
If you're evaluating whether your ad-platform bridge is set up properly, Facebook Conversion API is the kind of reference teams use to understand why server-side redundancy matters.
A quick pre-flight check helps before anyone trusts the numbers:
- Event naming: confirm every key ecommerce action has one standard event name.
- Source matching: compare purchase counts between platform reports and your analytics layer.
- Server-side backup: verify that critical conversion events still land when browser tracking is blocked.
- Identity stitching: test whether the same customer can be recognized across sessions and devices.
- Refund and return capture: make sure post-purchase events are included, not just first-order revenue.
Diagnostic habit: don't ask, “Is tracking on?” Ask, “Which events are missing, and where do they disappear?”
When this layer is stable, attribution gets more credible and experimentation gets cleaner. When it isn't, every debate about performance starts on broken ground.
Attribution, Incrementality, and Experimentation Compared
These three frameworks answer different questions, and mixing them up is where many teams stall. Attribution tells you where credit lands. Incrementality tells you whether the conversion would have happened anyway. Experimentation tells you what changed when you flipped a switch.
Attribution is fast and useful for pacing, but it's still a model. Incrementality is closer to the truth of causal lift, but it takes longer to design and read. Experimentation is the cleanest way to isolate change, but it usually needs planning, holdouts, or controlled exposure, which adds operational cost.
When each framework earns its place
Use attribution when the team needs a directional read on channel and campaign performance. It's the right tool for daily budget moves, creative rotation, and audience pruning. It breaks when teams mistake modeled credit for business truth.
Use incrementality when the question is whether a channel or tactic is adding sales, not just collecting them. That's especially important when brand search, retargeting, or always-on prospecting may be claiming conversions that were already likely to happen.
Use experimentation when the team wants to know whether a specific change, such as a landing page update, message variant, or offer adjustment, caused the difference. The tradeoff is operational discipline, because clean tests need enough volume and a stable setup to avoid false conclusions. The control-group approach outlined in control group testing is the kind of framework that keeps those tests honest.
| Framework | What it answers | Data needs | Main tradeoff |
|---|---|---|---|
| Attribution | Who gets credit | Event and spend data | Fast, but biased |
| Incrementality | Did it cause lift | Holdout or geo split data | Rigorous, but slower |
| Experimentation | What changed after the switch | Controlled exposure and stable tracking | Cleanest, but can cost ramp time |
A useful mental model is simple. If you're asking where to move budget today, attribution helps. If you're asking whether a channel deserves budget at all, incrementality helps. If you're asking whether a new creative, checkout flow, or offer works, experimentation is the better answer.
Connecting Analytics to Meta Ads and Creative Decisions
The cleanest Meta Ads workflow starts before anyone builds a new campaign. Historical performance gets pulled into one view, winners are ranked by ROAS, and the team checks which creatives, messages, and audiences drove the strongest results. That ranking then becomes the production brief, not a slide deck nobody reopens.
AdStellar AI is one platform that can sit in that workflow, because it ingests historical Meta performance, ranks creatives and audiences against metrics like ROAS, CPL, and CPA, and uses those winners to assemble new campaigns. The practical value isn't in the tool label, it's in the loop. Historical data informs the next launch, the next launch generates fresh data, and the next review sharpens the ranking again.
How the handoff works in practice
Start with the creative cut. If one message theme wins on revenue efficiency, the team doesn't just duplicate the same ad. It makes new variants around the winning angle, tests new hooks, and keeps the core offer intact while changing the framing. That's how analytics turns into production.
Then move to the audience cut. If a strong creative performs differently across age, placement, or audience segment, the team should not treat that as noise. It's a signal about where the message fits, which changes who gets bid on and how much spend each segment deserves.
The point isn't to produce more ads. The point is to produce more of the right combinations.
That loop matters most for performance teams running at speed. Bulk creative production only helps if the winners are ranked correctly. Otherwise, the team just scales noise faster. The best process is simple enough to repeat every week, but strict enough to keep the signal intact.
The decision chain looks like this, in order. Analytics identifies the winning pattern. Media buyers decide whether to scale, test, or cut. Creative teams build new variants from the pattern. The platform pushes the new set live. Fresh results feed the ranking model again. That's how analytics becomes a working system instead of a retrospective report.
The Hidden Side of Ecommerce KPIs, Returns and Margin Leakage
A rising conversion rate can still hide a falling business. If the orders are lower value, heavily discounted, or frequently returned, headline revenue can look healthy while contribution margin shrinks. That's why returns belong in the same conversation as ROAS, not in a separate operations report nobody checks.
Teams optimize for the sale they can see. The smarter move is to track the sale that stays profitable after returns, refunds, and discount leakage. A product that converts well but comes back often is not a win, it's delayed cost.
How to read profitability without fooling yourself
Start with SKU mix. If media pushes shoppers toward low-margin products, revenue can rise while margin quality falls. The pattern gets even harder to see when campaign dashboards group all sales together, because high-performing ads can hide the fact that they're driving the wrong basket.
Then add return analytics. Track which products come back, which channels drive those orders, and whether certain audience segments consistently generate weaker net revenue. Many teams discover that the best top-line campaign was the worst profit contributor.
Margin rule: if the dashboard only shows gross sales, it's missing the cost of getting the order back.
Reconciliation matters too. Leadership dashboards should compare revenue, refunds, and returns in one view so the team can see true contribution, not just booked sales. That lets finance, growth, and merchandising work from the same baseline instead of debating whose number is “right.”
The payoff is better bidding discipline. If a channel drives high-return SKUs, the media team can lower bids, change creative, or shift spend toward products with healthier economics. If a product category consistently leaks margin after returns, merchandising can fix the offer before paid media scales the problem.
A 90-Day Roadmap to Analytics Maturity
The fastest way to improve digital commerce analytics is to stop trying to solve everything at once. Start with tracking that you can trust, then add attribution, then layer in testing and creative feedback loops. Each step should make the next decision faster, not just produce more charts.
In the first 30 days, the work is mostly cleanup. Audit events, align KPI definitions, and build a dashboard that shows revenue, orders, conversion rate, traffic source, and the key funnel leaks. If the team can't agree on definitions by then, no model will save the reporting later.
A practical 90-day sequence
Days 31 to 60 should focus on attribution and incrementality baselines. That means testing which channels deserve credit, where last-click logic misleads the team, and where holdouts can reveal true lift. At the same time, start separating acquisition quality from raw volume so creative and bidding decisions stop relying on surface metrics.
Days 61 to 90 is when experimentation and Meta workflow integration start paying off. Build a cadence for creative testing, connect performance results back into winner ranking, and use the pattern to launch the next round of ads faster. This is also the moment to formalize how campaign learnings feed merchandising and audience strategy.
A mature stack usually looks like this:
- Clean event taxonomy across product, cart, checkout, purchase, and returns.
- Server-side redundancy for critical conversion events.
- One agreed KPI set for revenue, conversion, ROAS, RPV, abandonment, and margin.
- Attribution plus incrementality so credit and causality don't get confused.
- A testing cadence that turns insights into creative and bidding changes.
- A feedback loop between analytics, media buying, and merchandising.
If you've only got time for one next move, fix the measurement layer first, because every other decision depends on it.
If your team needs a cleaner way to turn ecommerce data into creative, bidding, and audience decisions, AdStellar AI is built for that workflow. It connects to Meta Ads Manager, ingests historical performance, ranks winners, and helps teams launch new campaign combinations from those results. Visit AdStellar AI to see how that loop can replace manual guesswork with a repeatable process.