Staring at your Meta Ads Manager dashboard can feel like you're drowning in data. You see clicks, impressions, and ad spend, but it’s just a sea of numbers without a clear story. What does it all mean?
This is where effective Facebook advertising reporting comes in. It’s the skill that turns you from someone overwhelmed by data into a marketer who uses it to make smart, profitable decisions. It’s about translating those confusing spreadsheets into a clear, actionable game plan.
Why Mastering Facebook Advertising Reporting Is a Superpower
Think of your ad reports not as a chore, but as your strategic superpower. It’s what turns your ad spend into predictable revenue. Without a solid handle on reporting, you’re basically flying blind, making budget decisions based on gut feelings instead of cold, hard data.
This guide will show you how top-tier marketers operationalize their data to drive real business growth with clarity and confidence. To really get it, it helps to understand the core ideas behind any good digital marketing reporting. These principles are universal, but they’re especially critical inside Meta’s ecosystem because of its massive scale.
The High Stakes of Data-Driven Decisions
Let’s be blunt: businesses that can’t interpret their data are leaving a staggering amount of money on the table. The platform's dominance is almost hard to comprehend. In 2025, Meta's full-year revenue hit an incredible $200.97 billion, with advertising making up $196.2 billion of that. That was a 22% jump from the year before, driven by an 18% surge in ad impressions in Q4 alone. You can dig into the numbers yourself on Statista.
This isn't just a platform; it's a digital economy. With that much money flowing through it, understanding your specific slice of that pie isn't just a good idea—it's essential for survival and growth.
A report is only as valuable as the action it inspires. The goal of Facebook advertising reporting isn't just to know your numbers; it's to know what to do next because of them.
What Strong Reporting Unlocks for You
When you build a solid reporting system, you’re doing more than just getting organized; you’re building a serious competitive edge. Once you master the fundamentals, you can:
- Identify Winning Strategies: Quickly pinpoint the ads, audiences, and creative that are actually delivering the highest return on ad spend (ROAS).
- Prevent Wasted Spend: Spot underperforming campaigns early on. This allows you to cut your losses and shift budget to what’s actually working, making every dollar count.
- Achieve Scalable Growth: Make confident decisions to pour more fuel on the fire. When your choices are backed by solid data, scaling successful campaigns becomes a calculated move, not a risky bet.
- Improve Creative Output: Use real performance data to inform your next round of ad creative. This creates a powerful feedback loop where your ads get smarter and more effective over time.
Ultimately, strong reporting is the bridge connecting your ad spend directly to business outcomes. To get a better handle on the specific numbers that build this bridge, check out our guide on essential performance marketing metrics.
Learning the Language of Your Campaign Data
Every single one of your ad campaigns is telling you a story. The catch? That story is written in the language of data. To actually understand what’s working—and what’s not—you need to become fluent.
Forget thinking about metrics as a long list of disconnected terms in a glossary. Instead, picture them as characters in a narrative. Each one has a role to play in your campaign’s plot. This simple shift in perspective makes Facebook advertising reporting less about staring at spreadsheets and more about genuine storytelling.
The first step is to figure out the main character of your story. This is your primary Key Performance Indicator (KPI)—the one metric that truly defines success for whatever you're trying to achieve. If you're running an e-commerce store, the protagonist is almost always Return on Ad Spend (ROAS). For a B2B company generating leads, it’s probably Cost per Lead (CPL). This single metric tells you if the story is headed for a happy ending.
But no protagonist acts alone. They’re always backed up by a supporting cast of secondary, diagnostic metrics that explain why the story is unfolding the way it is. These supporting characters are your Click-Through Rates (CTR), Costs per Click (CPC), and Frequency. They add the much-needed context and depth, helping you understand the plot twists along the way.
Main Characters: Key Metrics by Campaign Goal
The "story" of your campaign has different chapters, and each chapter focuses on a different set of metrics. The absolute foundation of clear analysis is aligning your reporting with your primary objective—whether that's Awareness, Engagement, or Conversion. You wouldn't judge a book's first chapter by its ending, right? In the same way, you shouldn't judge an awareness campaign by its sales numbers.
Awareness Goals: Here, the plot is all about introducing your brand to a new crowd. The main characters are metrics like Reach (how many unique people saw your ad) and Impressions (the total number of times your ad was shown). A crucial supporting metric is Cost per 1,000 Impressions (CPM), which tells you how efficiently you’re getting in front of people.
Engagement Goals: This chapter is about building a relationship and starting a conversation. The story revolves around actions—post reactions, comments, shares, and video views. The heroes of this chapter are metrics like Engagement Rate and Cost per Engagement, which show just how well your creative is hitting home with your audience.
Conversion Goals: This is the climax of your story, where you ask the audience to take a specific, valuable action. The protagonist is your core business metric—ROAS, Cost per Acquisition (CPA), or Cost per Lead (CPL). These are the numbers that directly tie back to your bottom line.
To make any sense of the mountain of data Meta throws at you, you have to filter it through the lens of your objective. This is how you turn a wall of noise into a clear signal.
This diagram shows how effective reporting acts as a filter, turning cluttered raw data into clear, actionable insights that you can actually use.
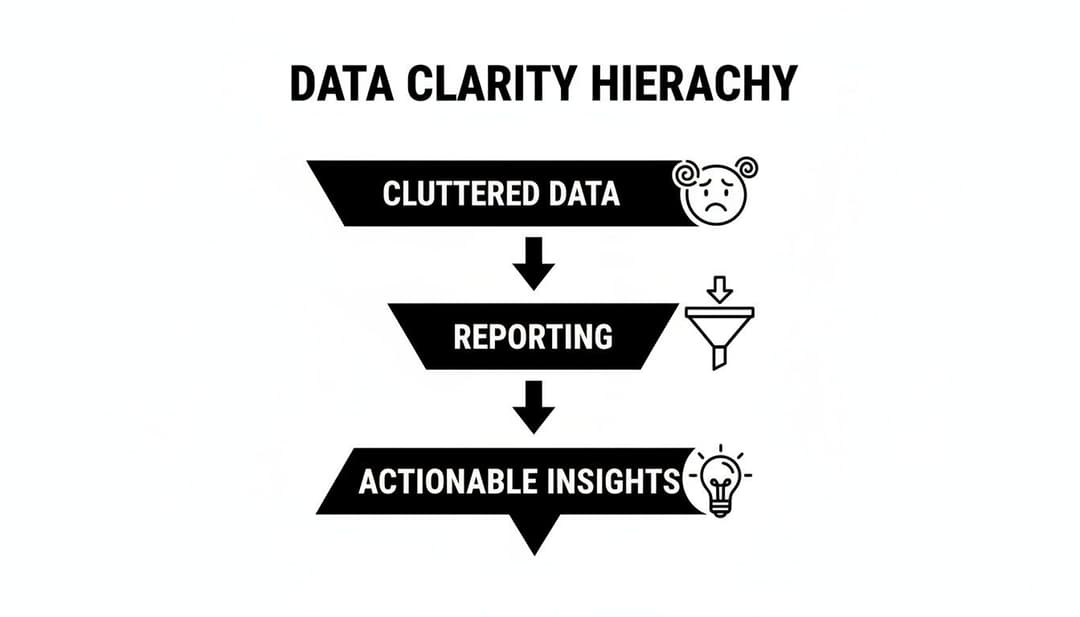
The key takeaway is that reporting isn't the final step. It's the critical middle piece that makes raw data genuinely useful for making smart decisions.
To help you focus on what really matters, we've broken down the essential metrics for each campaign goal. Think of this as your cheat sheet for campaign analysis.
Key Facebook Ad Metrics for Different Campaign Goals
| Campaign Goal | Primary Metrics (KPIs) | Secondary Diagnostic Metrics |
|---|---|---|
| Awareness | Reach, Impressions, Ad Recall Lift | CPM (Cost per 1,000 Impressions), Frequency, Video View Metrics |
| Engagement | Post Engagements, Page Likes, Event Responses | Engagement Rate, Cost per Engagement, CTR (Link) |
| Traffic | Link Clicks, Landing Page Views | CPC (Cost per Click), CTR (Link), CPM |
| Leads | Leads, Cost per Lead (CPL) | Conversion Rate, CTR (Link), CPC |
| Sales | Purchases, ROAS (Return on Ad Spend), CPA (Cost per Acquisition) | Conversion Value, CTR (Link), Add to Carts, Checkouts Initiated |
By organizing your reports this way, you can quickly see if you're hitting your main goal and then use the diagnostic metrics to understand the "why" behind the performance.
How Supporting Metrics Drive the Story
The real magic happens when you start connecting the dots and see how the supporting metrics influence your main KPI.
Let's say you have a low Click-Through Rate (CTR). This tells you people are seeing your ad but aren't finding it compelling enough to actually click. While the average CTR for Facebook ads hovers around 0.90%, this can swing wildly depending on your industry. A low CTR almost always leads to a higher Cost per Click (CPC), because Facebook's algorithm essentially penalizes ads that it deems less relevant to users.
This kicks off a domino effect. A high CPC directly inflates your Cost per Acquisition (CPA). If each click is costing you more, but your website's conversion rate stays the same, then each final sale or lead is also going to cost you more. All of a sudden, that campaign that looked profitable is deep in the red.
By keeping a close eye on these supporting characters, you can spot the plot holes before they ruin the ending.
Your diagnostic metrics are the early warning system for your primary KPIs. A dip in CTR today can signal a rise in CPA tomorrow.
When you understand these relationships, you graduate from just reading numbers to interpreting the narrative they represent. To go even deeper into how these metrics are calculated and what they signal, check out our full breakdown of Meta ads performance metrics explained. This knowledge lets you pinpoint exactly where your campaign story is going off-script so you can make the right edits and steer it toward a successful conclusion.
Finding Action-Ready Insights in Meta Ads Manager
The default view in Meta Ads Manager gives you a quick health check, but that’s about it. The numbers you see at first glance—your overall ROAS, your campaign-level CPA—are just the surface. They’re averages, and averages can be dangerously misleading.
To find the insights that actually let you make smart decisions, you have to dig deeper. This means treating Ads Manager less like a static dashboard and more like an interactive investigation tool. The real story is always hiding just one click away.
Your primary tool for this investigation? The “Breakdown” menu. It’s the key to slicing and dicing your data to answer the questions that really matter for optimization.

Instead of just knowing your overall Return on Ad Spend (ROAS), the Breakdown menu helps you get specific. For an e-commerce brand, you can stop wondering and start answering, "Which age group is actually driving our highest ROAS?" For a B2B advertiser, it turns a vague question into a clear one: "Are we getting cheaper leads from people on their phones or on their desktops?"
Uncovering What’s Really Working with Breakdowns
Think of breakdowns as different lenses you can put on your data. Each one brings a specific variable into focus so you can see what’s driving results and, just as importantly, what’s holding them back. You’ll find this feature right above the main reporting table in Ads Manager, and it's where the magic happens.
Here are a few of the most powerful breakdowns to start with:
- By Placement: Is Instagram Stories outperforming your Facebook Feed? Are Reels driving more clicks than Marketplace? This tells you exactly where to double down on your budget and what kind of creative to build next.
- By Age & Gender: This is where you find your true audience. You might discover that one ad is a massive hit with women aged 25-34 but a total dud with everyone else. That’s not a failure; it’s a signal to build a hyper-targeted campaign just for them.
- By Device: Are you seeing a huge performance gap between iOS, Android, and desktop? This could expose a clunky mobile landing page or simply reveal where your best customers prefer to shop.
Answering the "who, where, and what" of your campaign performance is impossible without using breakdowns. A campaign's average CPA might look perfectly fine, but a breakdown could reveal that one placement is wildly profitable while another is secretly burning through your entire budget.
Understanding Attribution Windows
As you dig into your reports, another concept you absolutely have to get your head around is the attribution window.
In simple terms, it’s the period after someone sees or clicks your ad during which Meta gives that ad credit for a conversion (like a purchase or a lead). It’s how the platform decides which ad gets the "assist" for the goal.
Think of it like this: if a customer sees a billboard for a new soda and then buys it three weeks later, should the billboard get the credit? What if they buy it that same day? The attribution window sets the rules for giving credit where it's due.
Meta’s most common settings are:
- 7-day click: A conversion is counted if it happens within 7 days of a user clicking your ad.
- 1-day view: A conversion is counted if it happens within 1 day of a user seeing your ad, even if they never clicked.
The right window depends entirely on your sales cycle. A cheap, impulse-buy product probably has a short consideration phase, so a 1-day click window makes sense. A high-ticket item or a B2B service might need a longer window, since people take more time to decide. This setting directly changes the conversion numbers you see, so it's crucial to know what you're looking at.
Creating and Saving Custom Reports
Once you start using breakdowns and custom columns, you'll quickly realize that setting up your perfect view every single time is a massive time sink. This is where saving custom report templates becomes a non-negotiable part of an efficient workflow.
After you've configured a report with the exact columns, breakdowns, and attribution settings you need—say, a "Weekly E-commerce ROAS Check"—you can save it as a template.
This simple step transforms your reporting from a repetitive, manual chore into a quick, repeatable analysis. You can build out a whole library of templates for different needs: a high-level summary for stakeholders, a granular creative analysis for your design team, or a deep-dive on lead quality for sales.
For a little more help getting your workspace set up, our guide on what Facebook Ads Manager is can walk you through the basics. By turning your analysis into a system, you’ll spend less time wrestling with data and more time actually acting on it.
Building Reporting Dashboards That Drive Decisions
Poking around in your data ad-hoc is one thing, but building a dedicated dashboard is how you turn reactive check-ins into a proactive growth machine. A great dashboard isn’t just a pile of metrics; it’s a decision-making tool built around your specific business goals. It cuts straight through the noise of Meta Ads Manager and puts the numbers that actually matter front and center, giving you a clear, consistent pulse on performance.
The trick is to stop trying to track everything at once. Instead, build a specific dashboard for each major objective you have. This focused approach makes sure your facebook advertising reporting is answering the right questions, helping you make smarter budget and creative calls—faster.

The E-commerce Dashboard
If you’re running an e-commerce business, the name of the game is profitable sales. Period. Your dashboard needs to reflect that obsession with efficiency and the customer’s path from that first click to the final purchase.
- Primary KPI: Return on Ad Spend (ROAS). This is your north star. It tells you exactly how many dollars you’re getting back for every dollar you put in.
- Secondary KPIs: Cost per Purchase (CPA) and Purchase Conversion Value. These add crucial context to ROAS, showing how much it costs to land a customer and the total revenue those sales are bringing in.
- Diagnostic Metrics: CTR (Link Click-Through Rate), Cost per Click (CPC), and funnel health checks like Adds to Cart and Checkouts Initiated.
Your e-commerce dashboard should give you immediate answers to these big-picture questions:
- Are my campaigns actually making money right now? (ROAS)
- How much am I paying to acquire a new customer? (CPA)
- Where are potential buyers dropping off? (Adds to Cart vs. Purchases)
When you structure your report this way, you spot problems in a heartbeat. For instance, if you see tons of Adds to Cart but a low number of Purchases, the issue probably isn't your ad creative—it's likely something broken in your checkout process.
The Lead Generation Dashboard
For B2B or service-based businesses, success isn’t an immediate sale. It’s all about acquiring high-quality leads at a cost that makes sense for your business. Your dashboard has to prioritize lead volume, cost-efficiency, and any signals you have about lead quality.
- Primary KPI: Cost per Lead (CPL). This is your core efficiency metric. You have to know precisely what you're paying to get a potential customer's contact information.
- Secondary KPIs: Total Leads and Lead Rate (or Conversion Rate). These track your overall volume and how effectively your landing page is converting traffic.
- Diagnostic Metrics: CTR (Link Click-Through Rate), CPC, and if you can, downstream metrics from your CRM like Cost per Marketing-Qualified Lead (MQL) or Cost per SQL.
This kind of dashboard answers the critical operational questions:
- What’s our price tag for a single lead? (CPL)
- Are we generating enough leads to keep the sales pipeline full? (Total Leads)
- Are these leads actually turning into real prospects? (Cost per MQL)
The fitness industry is a great example of this in action. They often see an average conversion rate of 14.29% on Facebook, showing just how powerful the platform can be for lead gen when you’re measuring the right things.
The Brand Awareness Dashboard
When your main goal is just to get your name out there, obsessing over direct conversions will only lead you astray. An awareness dashboard is all about measuring how effectively you’re reaching your target audience and grabbing their attention, all while keeping an eye on your budget.
An awareness campaign is like planting a seed. You don't measure its success by looking for fruit the next day. You measure it by how widely and efficiently you've sown the seeds.
- Primary KPI: Reach. This number tells you how many unique people saw your ad. It's the purest measure of how far your message has spread.
- Secondary KPIs: Impressions and Frequency. These fill in the picture, showing the total number of times your ad was seen and how many times, on average, each person saw it.
- Diagnostic Metrics: Cost per 1,000 Impressions (CPM) and video-specific metrics like ThruPlays or 3-second video plays.
This setup helps you understand:
- How many people in our target market have we actually gotten in front of? (Reach)
- Are we annoying our audience by showing them the same ad over and over? (Frequency)
- How cheaply are we getting our message out the door? (CPM)
The world of Facebook advertising reporting is a goldmine of data, but it’s easy to get buried in it. In 2025, Meta's ad revenue shot up to $196.2 billion a year, with ad impressions in Q4 alone jumping 18%. This shows the staggering amount of data flowing through the system. Raw Meta Ads Manager data can hide the real story, which is why these focused dashboards are so essential. You can dig deeper into this growth by reading the full report on Meta's impressive revenue surge at WARC.com.
For even more plug-and-play templates, check out our guide on building a complete Facebook ads reporting dashboard. By building these laser-focused dashboards, you stop passively looking at numbers and start turning your reporting into an engine for strategic growth.
Moving from Manual Reporting to Automated Intelligence
Are you buried in spreadsheets? If you’re like many marketers and agency pros, the biggest headache in Facebook advertising isn't a lack of data—it’s the soul-crushing manual work it takes to piece everything together.
Let’s be honest: exporting CSVs and wrestling with pivot tables feels productive, but it's an incredibly slow and clunky way to operate. This pain is especially sharp for agencies juggling multiple client accounts or brands running complex creative tests. Every hour you spend copying and pasting data is an hour you’re not spending on strategy.
This is the hard ceiling of manual reporting. It traps you in the role of a "data puller," chaining you to low-value tasks instead of making the high-impact decisions that actually move the needle. To scale your impact, you have to graduate from spreadsheets to systems.
The Shift to Automated Data Aggregation
The answer is automation. Modern reporting tools completely sidestep the limits of manual exports by plugging directly into the Meta API. Think of it as creating a live, automated pipeline for your performance data.
Instead of you having to pull data out, the system automatically gathers it for you in real-time. This simple shift eliminates human error, saves countless hours, and guarantees you’re always looking at the freshest information. Your focus moves from data collection to data interpretation.
Automation isn't about replacing the marketer; it's about empowering the marketer. It handles the repetitive tasks, freeing you up to focus on the creative and strategic work that drives real growth.
How AI Uncovers Winning Insights
True intelligence, however, goes beyond just putting all your numbers in one place. The next level is using AI to actively find insights that would be nearly impossible for a human to spot.
Think about it. With dozens of campaigns, hundreds of ads, and multiple audiences running at once, how could you possibly know which specific combination of an image, headline, and demographic is driving your best ROAS? AI-powered platforms are built to answer exactly these kinds of questions.
These systems can automatically analyze thousands of data points to show you your best-performing:
- Creative Assets: The platform can flag the exact images or videos that consistently generate the lowest Cost per Lead.
- Ad Copy Variations: AI can pinpoint the headline or primary text that gets the highest Click-Through Rate.
- Audience Segments: It can uncover hidden pockets of high-value customers you might have otherwise missed.
This approach is essential in today's competitive environment. With Facebook's worldwide ad revenues projected to be between $116.53 billion and $123.73 billion, the stakes are high. In this ecosystem, where Reels drive a huge chunk of the 60% of time people spend on video, agencies need technology to cut through the noise. According to this Oberlo report on Facebook's ad revenue, the market is massive and growing. AI-powered tools connect to your historical data, auto-generate creative combinations, and rank insights by CPA, slashing manual reporting time and helping your team scale high-ROAS campaigns.
By letting technology do the heavy lifting, you stop being reactive and become proactive. The insights come to you, clearly ranked and ready for you to take action. To learn more about how these platforms work, explore our guide on the best Facebook Ads reporting software.
Turning Your Reports Into Real Campaign Growth
An insight buried in a spreadsheet is worthless. The whole point of reporting is to turn that data into decisions that fuel real, measurable growth for your campaigns. This is where you close the loop, transforming your analysis into an engine for continuous improvement.
To pull this off, you need a rhythm—a consistent reporting cadence that lines up with different strategic levels. Trust me, you don't need to scrutinize every single metric every single day. Setting up a structured approach keeps you from getting lost in the data and makes sure you're focusing on what actually matters at the right time.
Your Actionable Reporting Cadence
Think of your reporting cadence like different zoom levels on a map. Each one serves a distinct purpose, from immediate damage control to long-term strategic planning.
Daily Check-In (5 minutes): This is your quick pulse check. The only goal here is to spot major issues before they burn a hole in your budget. Look at your top-level KPIs—overall Spend, ROAS, or CPL. Is everything stable? If not, you know exactly where to start digging.
Weekly Review (30-60 minutes): This is where the real optimization happens. Dive into your custom dashboards and analyze performance trends from the past week. This is your time to look at the campaign, ad set, and ad-level data to find your winners and losers.
Monthly Analysis (1-2 hours): This is for big-picture strategy. Step back and review audience performance, creative themes, and your progress against core business goals. How does this month’s CPL compare to last quarter’s average? Are certain audience segments starting to show signs of fatigue?
This structured cadence creates a powerful feedback loop. Your weekly ROAS report directly informs what creative you'll test next week, while your monthly audience breakdown influences how you'll allocate the budget for the following quarter.
An insight is a question you can act on. A good report doesn't just show you what happened; it forces you to ask, "What should we test next to make this better?"
A Simple Framework for Continuous Growth
To actually put your findings into practice, adopt a simple but powerful "Analyze, Hypothesize, Test" model. This framework is the bridge between your data and execution, ensuring your reporting directly translates into better campaign performance.
Let's walk through an example:
- Analyze: Your weekly review reveals that one of your ad creatives has a killer ROAS, but you notice its frequency is climbing fast.
- Hypothesize: You form a hypothesis: "The core concept of this ad is clearly resonating, but the audience is getting tired of seeing the exact same visual. A fresh creative using a similar message and angle will probably perform just as well—if not better—and reset the frequency."
- Test: You launch an A/B test. The original ad (your control) runs against two new variations (your challengers) that use the same copy but feature different images or videos.
This disciplined process turns reporting from a passive, backward-looking activity into an active driver of growth. To really get the most out of this, it helps to understand what makes an ad effective in the first place, like the structures found in these real estate ad examples.
By consistently analyzing your data, forming educated guesses, and then testing your assumptions, you build a system that guarantees your campaigns are always getting smarter.
Common Questions About Facebook Ads Reporting
Even with the best reporting setup, you're going to have questions. It’s just part of the job. Navigating the finer points of Facebook advertising reporting can throw even seasoned pros for a loop, so let's clear up a few of the most common ones we hear all the time.
How Often Should I Check My Facebook Ads Reports?
This is a classic "it depends" question. The right answer comes down to your budget and what you’re trying to achieve. There’s no one-size-fits-all schedule, but most advertisers find success with a tiered approach.
Daily Check-ins (5-10 minutes): If you're spending big (think over $1,000/day), you need to be in your account every single day. This isn't about deep analysis; it's a quick gut check on top-level KPIs like Spend, ROAS, or CPA. Your goal is simple: spot any major fires before they torch your budget.
Weekly Reviews (30-60 minutes): This is where the real work happens. Set aside time once a week for a deeper dive. This is your moment to spot trends, find out which ads are actually working, and make the call to shift budget away from the duds.
Monthly Analysis (1-2 hours): Think big picture. This is your time to zoom out and focus on high-level strategy. Are you hitting your business goals? Are your audiences getting tired of seeing the same ads? Use this session to plan your creative and budget strategy for the month ahead.
Why Does My Facebook Report Show Different Data Than Google Analytics?
Ah, the million-dollar question. This is easily one of the most common points of confusion, and the answer almost always boils down to one thing: attribution. Facebook and Google are two different tools measuring the customer journey through completely different lenses.
Facebook Ads Manager uses a multi-touch attribution model by default (like 7-day click and 1-day view). This means it takes credit for a sale if someone clicked your ad in the last week or even just saw it in the last day before converting. On the other hand, Google Analytics usually defaults to a last-click model, giving 100% of the credit to whatever the person did right before they converted.
Neither one is "wrong"—they just tell different parts of the story. Use Facebook to understand how your ads are performing within its own ecosystem, and use Google Analytics to see how it all fits together with your other marketing channels.
Think of it this way: Facebook reporting tells you how many assists your ads made, while Google Analytics often just tells you who scored the final goal. Both pieces of information are valuable for understanding the whole game.
What Is a Good ROAS for Facebook Ads?
Anyone who gives you a single number here is selling you something. A "good" Return on Ad Spend (ROAS) is completely tied to your specific industry and, more importantly, your profit margins. People love to throw around 4:1 ($4 in revenue for every $1 spent) as a benchmark, but that's a dangerously generic piece of advice.
A business selling high-margin software could be wildly profitable at a 2:1 ROAS. But a company with razor-thin margins on physical goods might need a 10:1 ROAS just to stay afloat.
The only number that truly matters is your number. You need to calculate your break-even ROAS—the point where the profit from the sales you generate completely covers your ad spend. Any return above that specific figure is pure profit, and that becomes your personal benchmark for a "good" ROAS.
Ready to stop wrestling with spreadsheets and start scaling your campaigns? AdStellar AI automates bulk ad creation and uses AI to surface your top-performing creatives, audiences, and copy against your core business goals. Launch, test, and scale Meta ad campaigns 10x faster with AdStellar AI.