Statistical significance asks whether a result is likely due to a real effect or just random chance. In most fields, that judgment uses a threshold of 0.05, which means if p ≤ 0.05, researchers treat the result as unlikely to have happened by chance alone and reject the null hypothesis.
If you're running Meta ads, you've probably been in this spot. One creative looks better after a short test, the dashboard starts hinting at a winner, and the urge to move budget fast feels completely rational.
Then the "winner" fades.
That doesn't always mean testing is broken. It usually means the result was more fragile than it looked. What is statistical significance really about? It's a reliability check. It helps you separate signal from noise. But for marketers, the bigger question isn't just "Is this real?" It's "Is this worth acting on?"
Why Your 'Winning' A/B Test Might Be Lying to You
A paid social manager launches two Meta ad creatives on Monday. By Wednesday, Creative B has a lower cost per lead in Ads Manager. The team reacts in a typical fashion. They pause Creative A, shift spend into B, and tell the client they found a winner.
A week later, blended performance gets worse. Lead quality dips. Cost creeps up. What looked decisive turns out to be unstable.
That situation happens because ad results move around even when nothing meaningful has changed. A few early conversions can make one creative look stronger than it really is. A temporary audience pocket can make one headline seem sharper than another. Short test windows amplify that problem.
Why early winners are seductive
Marketing dashboards are built for action. Green numbers trigger confidence. Red numbers trigger cuts. That instinct is useful when a campaign is obviously broken, but it's dangerous when you're reading a small test as if it were settled fact.
A/B tests don't just measure performance. They also measure uncertainty.
When marketers skip that second part, they treat every early gap as proof. That's how teams end up scaling noise.
A test result can look directional before it becomes dependable.
The real decision isn't winner or loser
Organizations often frame ad tests as a horse race. Which version won? But the better framing is this:
- Question one: Is the difference likely real?
- Question two: If it's real, is it big enough to matter?
- Question three: Is the risk of acting now acceptable?
That shift matters because a statistically shaky result can waste budget, and a statistically clean result can still be too small to justify a change.
Performance marketers don't need academic purity. They need a disciplined way to avoid false confidence. That's where statistical significance becomes useful. Not as a magic green light, but as a filter between "interesting" and "actionable."
Statistical Significance Explained With a Courtroom Analogy
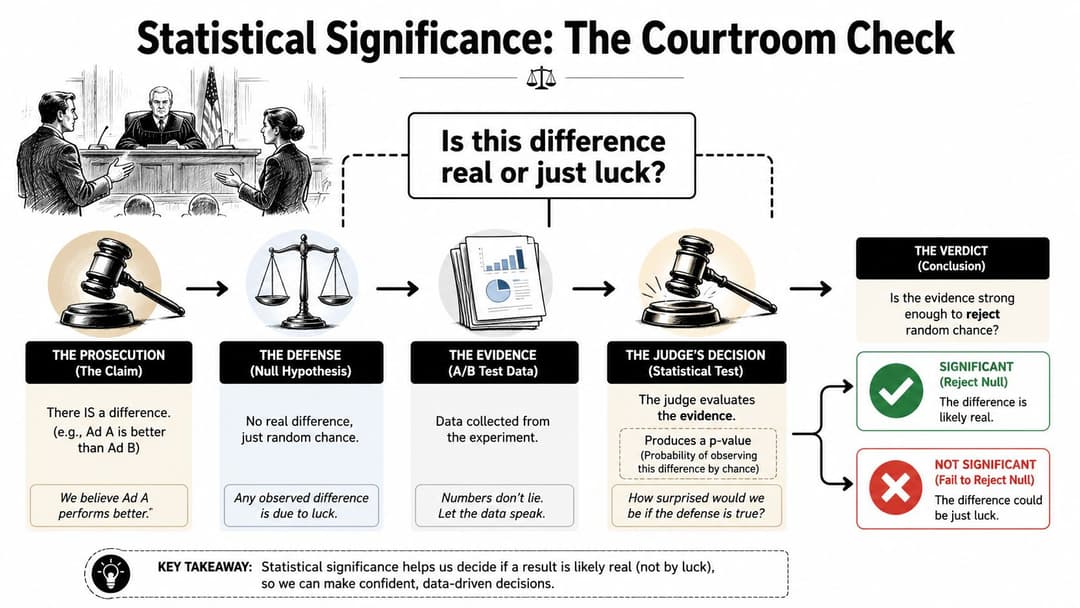
The simplest way to understand statistical significance is to think like a courtroom.
Start with innocent until proven guilty
In a legal trial, the defendant starts out presumed innocent. In an A/B test, the equivalent starting point is the null hypothesis. That means you begin by assuming there's no real difference between Ad A and Ad B.
Not "B is probably better." Not "A seems weaker." The starting assumption is that any gap you're seeing could just be random variation.
That's what makes significance testing useful. It forces discipline before confidence.
What the p-value is actually asking
Your ad data is the evidence presented in court. Clicks, leads, purchases, conversion rates, and cost metrics all become part of the case.
The p-value asks a narrow question: if the null hypothesis were true, what's the probability of seeing a result this extreme, or more extreme, just by chance? The standard significance level, α, is most commonly set at 0.05, and when p ≤ 0.05, the result is considered statistically significant and the null hypothesis is rejected, as explained in this overview of how p-values and alpha work.
That is not the same as saying there's a 95% chance your ad is a winner. That's one of the most common mistakes people make.
A plain-language translation
Here's the courtroom version:
| Courtroom idea | A/B testing idea |
|---|---|
| Defendant is innocent | No real difference between ad variants |
| Prosecutor presents evidence | Your test data shows a gap |
| Judge applies a standard | You compare p-value to alpha |
| Enough evidence to convict | Enough evidence to reject "no difference" |
| Not enough evidence | You can't rule out chance |
Notice what's missing. A conviction doesn't tell you how important the crime was. In the same way, statistical significance doesn't tell you how valuable the effect is.
Why marketers need this framing
If you test headlines, visuals, offers, or hooks on Meta, you're constantly deciding whether a gap is real enough to trust. A courtroom analogy helps because it keeps you from overclaiming.
You are not proving that Ad B is amazing. You are testing whether the evidence is strong enough to reject the idea that the difference is random.
Practical rule: Statistical significance answers "Is this likely real?" It does not answer "Should I bet more budget on it?"
That distinction becomes even more important when you're building a repeatable process for Facebook ad creative testing methodology. Teams that test regularly need a standard for evidence, not just intuition dressed up as analysis.
What a significant result means and doesn't mean
If your result clears the threshold, you can say the observed difference is unlikely to be random under the assumptions of the test.
You can't say:
- Guaranteed future performance: The next week will look the same.
- Large business impact: The lift is meaningful to revenue or profit.
- Universal truth: The result will hold across every audience, placement, and offer.
That's why significance is a checkpoint, not a verdict on strategy.
Statistical Significance vs Practical Significance
This is the distinction often overlooked in marketing.
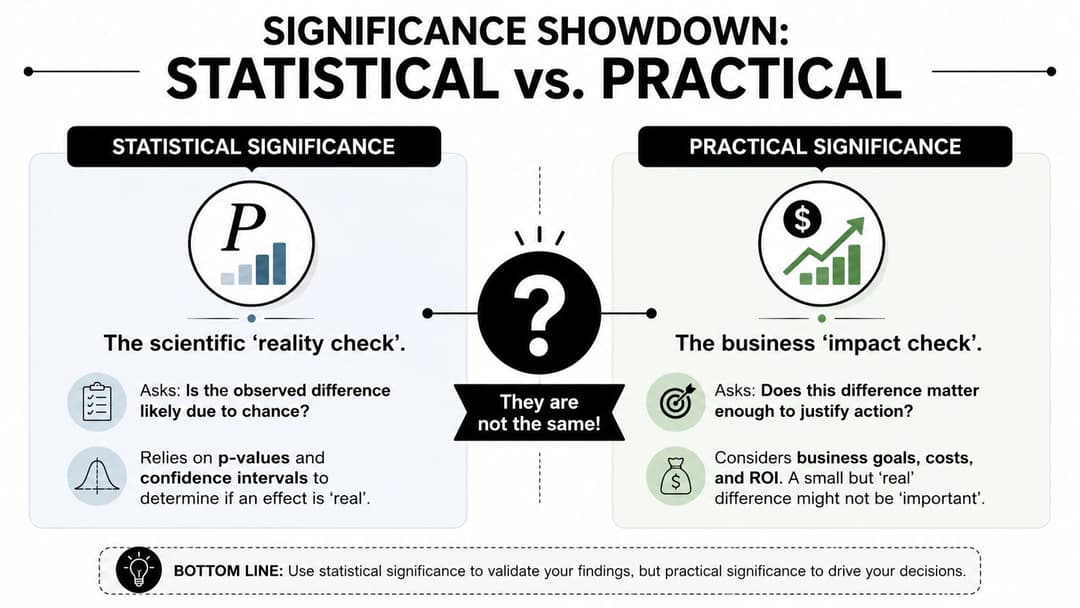
A result can be statistically significant and still not matter much to the business. In fact, recent data shows 68% of marketers in Meta ad testing assume statistical significance equals business impact, even though significance only rejects the null hypothesis of "no effect" and doesn't confirm the effect is large, profitable, or relevant to real decisions, according to this analysis on statistical versus business impact in Meta ad testing.
A result can be real and still be trivial
Think about a product claim. If a pill produces a measurable effect, that effect might be real in a statistical sense. But if the change is tiny, most buyers won't care. Marketing tests work the same way.
If a new ad headline produces a detectable lift, that doesn't automatically mean you should rebuild the campaign around it. Maybe the gain is too small to survive normal week-to-week volatility. Maybe it doesn't offset creative fatigue. Maybe it improves click-through rate but hurts lead quality downstream.
Practical significance addresses this. It asks whether the effect is large enough to justify action.
The business check marketers actually need
When you review an A/B test, don't stop at "significant" or "not significant." Ask sharper questions:
- Does the change improve a metric that matters? Clicks are nice. Qualified leads and purchases matter more.
- Is the effect large enough to change the decision? A tiny edge may not justify budget reallocation.
- Will the operational cost outweigh the gain? Rebuilding creative, changing landing pages, or shifting spend all have consequences.
A smart team defines practical significance before the test starts. That way you're not lowering your standards after seeing the data.
A simple comparison
| Type of significance | Core question | What it helps you decide |
|---|---|---|
| Statistical significance | Is the observed difference likely due to more than random chance? | Whether the signal is reliable enough to take seriously |
| Practical significance | Is the difference large enough to matter for the business? | Whether the result deserves rollout, budget, or process change |
If you only use the first row, you can end up making clean but bad decisions.
Don't confuse a reliable effect with a useful one.
What to look at besides the p-value
Marketers don't need to become academic statisticians, but they do need a wider decision lens. Useful checks include:
- Effect size: How big is the observed gap?
- Business relevance: Does it affect CPL, CPA, ROAS, or another core outcome?
- Downstream quality: Did better front-end metrics produce worse sales efficiency later?
- Implementation cost: Is the lift worth the effort and risk?
That same discipline shows up in broader optimization work like improving conversion rates. You don't make changes because a number moved. You make changes because the movement is both credible and meaningful.
The Key Ingredients Statistical Power and Sample Size
Some bad test decisions don't come from misunderstanding p-values. They come from running weak tests in the first place.
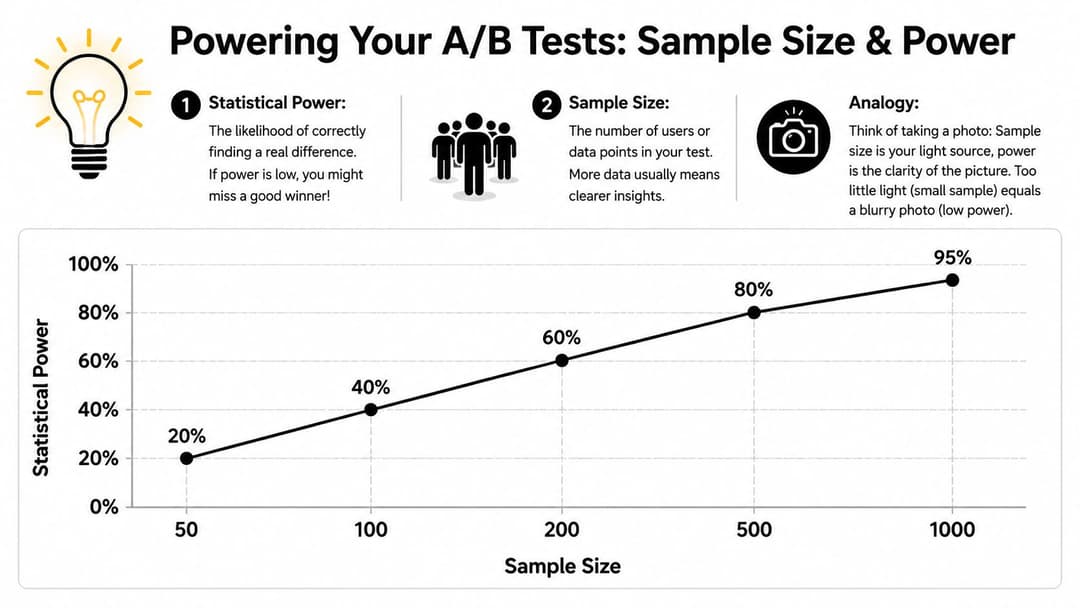
A useful analogy is a blurry photo. Sample size is how much visual information you captured. Statistical power is your ability to detect a real difference clearly. With too little data, the image is fuzzy. You might think you see a winner, or miss one that exists.
Why weak tests create false confidence
If you run a test on thin data, normal randomness can dominate the outcome. One or two extra conversions can swing the result. That doesn't mean the difference is fake. It means you haven't observed enough to judge it well.
Hypothesis testing commonly uses tools like a t-test for comparing means or a Z-test for proportions to generate a p-value. The convention of p = 0.05 became dominant after Ronald Fisher's 1925 publication, but even a statistically significant result such as p = 0.04 can still have negligible practical impact, as outlined in this summary of statistical significance and hypothesis testing.
That last point matters because marketers often treat "significant" as the end of the conversation, when test quality should have been part of the conversation from day one.
What sample size changes
More data doesn't guarantee good judgment, but it usually improves your chance of making one. A larger sample helps you separate a durable pattern from short-term noise.
Here's the practical version:
- Small sample: Easy to overreact. Hard to trust.
- Larger sample: More stable read on performance.
- Mismatch between traffic and ambition: You test lots of creative ideas without enough volume to evaluate any of them well.
Why peeking is a problem
A common habit in ad testing is checking results every few hours and stopping when one variant looks ahead. That feels efficient. It usually isn't.
Repeated peeking encourages premature calls. You're treating a moving snapshot like a finished result. If your sample is still thin, your test behaves like that blurry photo. You keep zooming in, but the detail isn't there.
Better evidence comes from a test plan you set before launch, not from refreshing the dashboard until you see a result you like.
What to do before launch
A stronger workflow looks like this:
- Choose the primary metric early. Don't switch from CPL to CTR halfway through.
- Estimate the sample you need. Tie it to the kind of difference you care about.
- Let the test run cleanly. Avoid adding variables midstream.
- Review the result in context. Reliability first, business value second.
If your team wants a more structured process, a guide to sample size for testing can help turn testing from guesswork into planning.
How to Apply Significance in Your Meta Ad Campaigns
The manual calculation of every statistical detail is rarely necessary. However, a trustworthy decision process remains vital.
Start with a real campaign question. Say you're testing two Meta headlines for the same offer. One headline leads with a direct value proposition. The other leads with a pain point. Same audience, same landing page, same optimization event. The only thing that changes is the message.

Before the test starts
The most important work happens before spend goes live.
Write down the hypothesis in plain English. For example: "The pain-point headline will lower CPL compared with the value-proposition headline." Keep it specific enough to test and narrow enough to interpret.
Then define what counts as a meaningful win for the business. Not just a reliable difference. A useful one. If the gap is too small to change your budget decision, it's not practically significant for your team, even if the stats come back clean.
A good setup checklist includes:
- One variable at a time: Change the headline, not the headline, image, and CTA together.
- One primary success metric: Pick CPL, CPA, or another decision-driving metric.
- A stopping rule: Decide in advance when you'll review the result.
- A business threshold: State what size of improvement would justify scaling.
While the test is running
Discipline usually breaks down at this point.
You open Ads Manager, see a temporary gap, and start telling yourself a story. One ad "obviously resonates." Another "clearly isn't landing." That story may be right. It may also be your pattern-seeking brain rushing ahead of the evidence.
Instead, monitor the test for quality, not for a winner. Check delivery balance, broken links, tracking issues, and obvious setup errors. Don't keep rewriting the conclusion in your head.
If you need a structured workflow for A/B testing Facebook ad creatives, use one that forces consistency in variables, metrics, and review timing.
After the test ends
Once the data is mature enough for review, ask three questions in order:
Is the result statistically credible?
You need evidence that the gap is unlikely to be random.Is the effect practically meaningful?
If the difference doesn't change a business decision, it isn't a real win.Is the result operationally trustworthy?
Did both variants get fair delivery? Was the audience stable? Did landing page issues distort outcomes?
That order matters. Teams often jump straight to excitement about the top-line metric and skip the integrity check.
A scale or hold framework
Use this simple decision guide:
| Test outcome | Recommended action |
|---|---|
| Reliable result and meaningful business impact | Scale cautiously, then verify in live spend |
| Reliable result but small business impact | Log the learning, but don't overreact |
| Unclear reliability but promising direction | Keep testing or gather more data |
| No reliable difference | Treat the variants as functionally similar for now |
This framework keeps you from turning every directional read into a full-budget decision.
Where tools fit
If you're managing many creatives, manual analysis gets messy fast. Tools can help organize hypotheses, keep variants clean, and surface likely winners based on the metric you're optimizing. AdStellar AI is one example. It automates bulk Meta ad creation, ingests historical performance, and surfaces creative, audience, and message insights against goals like ROAS, CPL, or CPA.
That's useful because the operational problem in testing isn't just statistics. It's consistency. Teams lose rigor when they're launching lots of ads and interpreting them under time pressure.
The best testing process doesn't make you slower. It stops you from moving fast on weak evidence.
Common Pitfalls and How to Avoid Them
By the time many organizations learn statistical significance, they've already built a few bad habits around it.
The first is treating 0.05 like a law of nature. It isn't. Data discussed in performance marketing circles shows 57% of A/B tests in performance marketing reject valid hypotheses due to rigid 0.05 cutoffs, especially when sample sizes under 1,000 clicks inflate false positives, and the 0.05 threshold itself traces back to debate among just two statisticians rather than empirical consensus, as discussed in this piece on why 0.01 and 0.05 became decision rules.
That doesn't make 0.05 useless. It means you should treat it as a convention, not a commandment.
Pitfall one: p-hacking your way to a winner
A test doesn't reach significance, so someone slices results by age, then by gender, then by placement, then by device, until one segment produces a "win."
That's not disciplined analysis. That's a search for a comforting answer.
If you didn't define those segment checks beforehand, treat them as exploratory. They may generate hypotheses for future tests, but they shouldn't carry the same weight as a clean preplanned comparison.
Pitfall two: acting on significance without business context
A result can clear a statistical threshold and still be too small, too noisy in practice, or too costly to implement. In such cases, marketers lose money while believing they're being rigorous.
Use a decision lens that includes:
- Risk level: A small budget shift and a major budget reallocation shouldn't require the same level of certainty.
- Metric quality: A lift in clicks may not matter if lead quality drops.
- Business payoff: If the upside is marginal, keep the learning but skip the rollout.
Pitfall three: stopping when the dashboard gets exciting
Peeking is appealing because media buying rewards speed. But the more often you search for a stopping point based on emerging results, the easier it becomes to mistake volatility for evidence.
A better habit is to predefine the review window and stick to it unless the test is clearly broken.
Pitfall four: outsourcing judgment to the number
Marketers sometimes ask, "Was it significant?" as if that single answer settles the decision. It doesn't.
Statistical significance is one input. Creative strategy, audience quality, unit economics, offer strength, and operational risk still matter. Automation can help enforce cleaner workflows, especially if you're trying to automate Facebook ad testing, but no tool should replace judgment.
Good analysts don't worship the threshold. They use it, then ask whether the result deserves action.
The strongest teams treat significance as a filter. Not a trophy. Not a shortcut. Just a disciplined way to ask whether the difference in front of them is credible enough to earn the next question.
If your team is running lots of Meta tests and wants cleaner signals without manual spreadsheet work, AdStellar AI can help structure launch, testing, and analysis around the metrics you use to make scale decisions.