
Your team wants analytics it can trust, but the decision isn't simple. Privacy requirements are tightening, consent loss is weakening client-side coverage, event volumes can make usage-based pricing unpredictable, and product teams want answers that standard traffic reports can't provide. At the same time, nobody wants a migration that consumes months of implementation time or quietly breaks campaign attribution.
There's no universal alternative Google Analytics tool. Adobe Analytics fits organizations that need enterprise governance and cross-channel analysis. Amplitude and Mixpanel answer product-behavior questions. Plausible, Fathom, and Simple Analytics focus on lightweight web reporting. Matomo and Piwik PRO put more emphasis on privacy and data control, while PostHog combines analytics with an operational product stack.
The comparison below evaluates each platform through the decisions teams face: measurement depth, privacy and retention control, pricing mechanics, migration effort, and the first configuration worth implementing. It also includes practical switching guidance, because replacing a tracking script is easier than preserving useful attribution.
If you're also managing Meta campaigns, Up North Media's behavior analytics guide provides useful context for connecting traffic data with on-site behavior. AdStellar AI can complement that workflow by using Meta performance data to rank creatives, audiences, and messages. It's an ad-operations platform, not a Google Analytics replacement.
1. Adobe Analytics
Adobe Analytics is the strongest fit when web reporting is only one part of a larger measurement system. It supports complex segmentation, workspace analysis, cohorting, attribution, data feeds, warehouse exports, and integrations across the Adobe Experience Cloud, including Adobe Experience Platform, Adobe Journey Optimizer, and Adobe Experience Manager. That makes it relevant to multi-site, multi-brand organizations that need consistent governance without forcing every business unit into the same report.
The trade-off is operational weight. Adobe uses a quote-based commercial model, and the cost includes implementation expertise, taxonomy design, permissions, documentation, and ongoing maintenance. A team that only needs pageviews, sources, landing pages, and conversion totals will likely take on more complexity than it needs.
Practical rule: Don't recreate every legacy report first. Decide which business decisions require governed data, then build those reports around standardized dimensions and segments.
Migration should begin with a cross-channel measurement inventory. Document current tags, events, identities, attribution rules, consent states, access groups, and data-feed requirements before anyone rebuilds dashboards. This is also the right stage to decide whether Adobe Analytics, a warehouse, or both should hold the long-term reporting model.
The first configuration should establish a governed Workspace template, standardized dimensions and segments, SSO or SAML access, and warehouse exports. That foundation matters more than reproducing every familiar GA report. Teams comparing Adobe with other digital commerce analytics approaches should also separate customer-journey analysis from ad-platform optimization, because the two systems answer different questions.
Explore Adobe Analytics when governance, scale, and cross-channel customization outweigh implementation simplicity.
2. Amplitude Analytics
Amplitude is built for the question Google Analytics often leaves underdeveloped: what do users do after acquisition? Instead of stopping at campaign source, landing page, and session activity, teams can connect UTMs and campaign properties to funnels, paths, retention cohorts, impact analysis, session replay, experimentation, and downstream revenue behavior.
That makes Amplitude particularly useful for SaaS, mobile, subscription, and product-led teams. A marketer can investigate whether a campaign produces sign-ups, while a product manager can follow the same users through activation and retention. The shared model reduces the gap between acquisition reporting and product analysis.
Amplitude offers a generous free tier and strong self-serve capabilities, but pricing can scale with monthly tracked users, events, and paid features. Session replay and experimentation also introduce governance questions. Teams should decide which users and journeys need replay before enabling it broadly, rather than collecting every possible interaction by default.
Migration requires more than translating GA4 event names. Map existing events into a product taxonomy, define account and user identity carefully, and validate funnel and retention calculations against known business outcomes. Differences in identity rules can make two systems appear inconsistent even when both are collecting data correctly.
Start with a small event dictionary, core funnels, retention cohorts, and campaign-source properties. Add replay and experimentation after the team has agreed on naming, ownership, consent behavior, and data minimization.
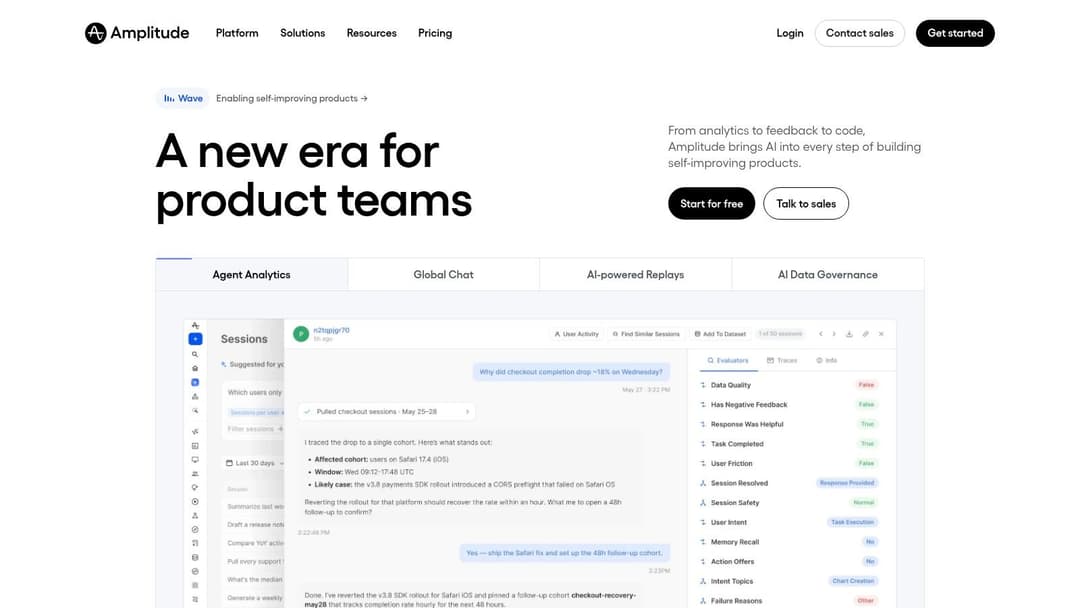
Review Amplitude Analytics if your primary measurement problem involves activation, retention, feature adoption, or revenue after the first visit.
3. Mixpanel
Mixpanel gives growth and product teams a fast, self-serve environment for event-based analysis. Funnels, retention, flows, cohorts, anomaly detection, metric trees, session replay, feature flags, and marketing templates all support a workflow built around user behavior rather than pageview summaries.
Its clearest advantage is usability for teams that need answers without routing every question through an analyst. A product manager can inspect a drop-off path, a marketer can compare campaign cohorts, and a growth team can connect an acquisition property to a later action. Mixpanel also provides a transparent pricing calculator, which makes initial planning easier than a fully sales-assisted quote.
The weakness appears when tracking discipline is missing. Event overages can change the economics at scale, and a broad schema can create a large inventory of low-value events. Mixpanel won't fix unclear measurement ownership. It gives teams more analytical freedom, which means they need stronger conventions.
Migration should prioritize four decisions:
- Naming conventions: Use predictable verbs and objects, such as a consistent structure for sign-up, activation, purchase, and subscription events.
- Event properties: Define the properties that support real decisions, rather than attaching every available field.
- Identity resolution: Decide how anonymous visitors, authenticated users, accounts, and devices should relate.
- Parallel validation: Run key Mixpanel and GA reports together long enough to explain differences in definitions.
A canonical event schema should come before dashboards. Build metric trees around the outcomes the team manages, then limit collection to events that product, marketing, or customer teams will use. Campaign parameters also deserve careful treatment, so document the rules in your UTM tracking process.
Visit Mixpanel when self-serve product analysis matters more than traditional content and traffic reporting.
4. Heap by Contentsquare
Heap speeds migration through Autocapture. After installation, it records user interactions, allowing teams to analyze behavior retroactively instead of defining every event before deployment. This suits sites where pages, forms, navigation, and campaign landing experiences change often.
The main benefit is faster discovery. Analysts can investigate an unexpected interaction and review a journey without waiting for another tracking release. Heap's journey maps and conversion-friction analysis are especially useful for understanding website visitor tracking patterns and locating trouble in a flow.
The trade-off is governance. Unfiltered interaction data can become noisy, inconsistent, or inappropriate to retain. Teams need rules to block or filter sensitive fields, plus agreement on which journeys deserve regular review. Autocapture shortens initial instrumentation, but it does not replace analytics design.
“Capture broadly, report narrowly” is a useful operating principle for Heap. Collection and interpretation should not have the same scope.
Start migration with an audit of captured interactions. Mark fields to block, interactions to filter, and priority journeys that match existing conversion definitions. Compare Heap's friction findings with current conversion reports and customer-support evidence. This exposes differences caused by tracking coverage rather than genuine behavior changes.
Configure a small set of journey maps and conversion definitions first. Expand capture rules only after product, marketing, legal, and analytics owners agree on data standards. Pricing and higher-tier capabilities are sales-assisted and vary, so compare expected capture volume with the governance controls the team can support. Heap fits teams that value retroactive behavioral analysis, while teams with a tightly manual event plan may prefer more deliberate instrumentation.
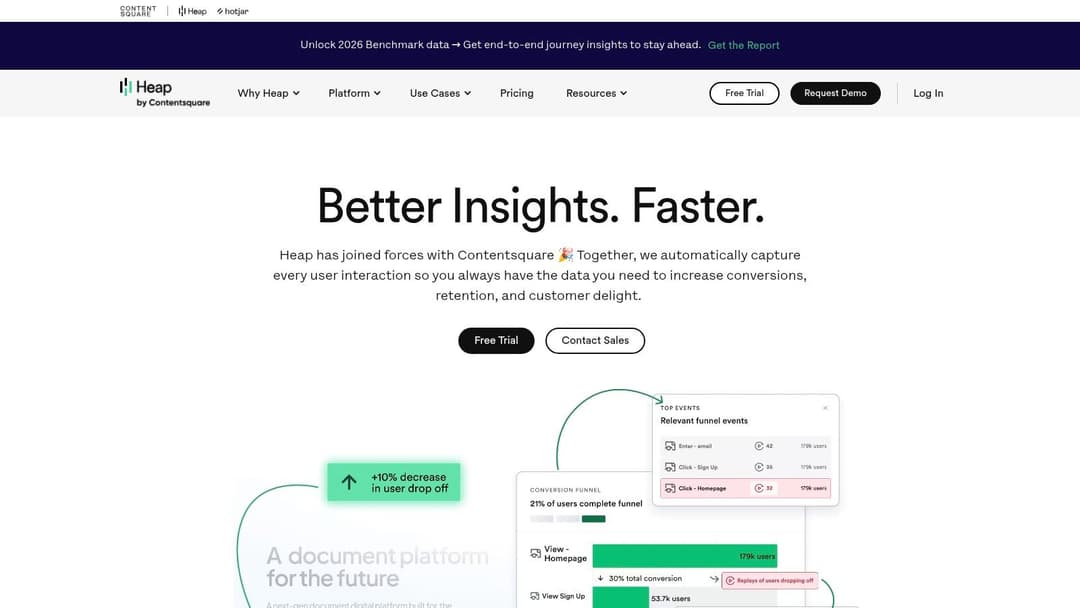
See Heap when discovering unplanned user behavior matters more than controlling every event before collection.
5. PostHog
PostHog is designed for teams that want analytics close to the product development workflow. Its platform combines event analytics, autocapture, session replay, surveys, feature flags, A/B testing, and error tracking. Cloud and self-hosted options give engineering teams a choice between managed operations and greater infrastructure control.
That combination can reduce vendor sprawl. A team can analyze a feature, expose it through a flag, collect feedback, inspect replay, and monitor errors in one environment. The model works best when developers and analysts share responsibility for event schemas and release workflows.
The trade-off is usage-based economics and implementation ownership. High-traffic sites can generate substantial event volume, and smaller teams may need help deciding what to track. Self-hosting also shifts responsibility for deployment, updates, security, backups, and availability to the organization.
Migration should begin by separating cloud responsibilities from self-hosted responsibilities. Decide where data will live, which event-volume controls are required, which existing tools PostHog can replace, and which systems still need to receive events. Don't assume that consolidating tools automatically consolidates definitions.
Configure the core product lifecycle first. That might include acquisition, sign-up, activation, purchase, renewal, or cancellation, depending on the business. Apply data-minimization rules to replay and surveys, then connect feature flags to a documented release process so experiment exposure can be interpreted correctly.
Explore PostHog if your team wants one developer-friendly stack for product analytics, experimentation, feedback, and error analysis.
6. Matomo Cloud and On-Premise
Matomo is one of the most established non-Google choices in the market. A 2026 market snapshot estimates Matomo at 2.5% of tracked websites, while another estimate reports 1.6% of all websites globally and more than 1 million installations across 190+ countries. These estimates come from the market snapshot reviewed by Quantumrun, and they illustrate adoption without suggesting that Matomo has Google's scale.
Matomo's appeal is control. Cloud hosting reduces operational work, while on-premise deployment gives organizations ownership over infrastructure, data residency, retention, and access decisions. The platform supports ecommerce tracking, funnels, cohorts, heatmaps, session recording, attribution, tag management, and a Google Analytics importer. On-premise bundles can extend the platform further, but they also require management.
The migration path is more direct than with a pure product-analytics tool. Use the importer where it fits, then reconcile goals, ecommerce events, consent behavior, attribution definitions, and historical reporting expectations. Historical numbers won't necessarily align because the two platforms may treat sessions, users, conversions, and consented traffic differently.
Start with privacy controls, retention and deletion rules, tag management, and key conversions. Add heatmaps or recordings only when they answer a specific usability question. Self-hosting can reduce dependence on a SaaS vendor, but it doesn't remove the need for backups, access control, patching, monitoring, and a documented incident process.

Compare Matomo Cloud and On-Premise when data ownership and traditional web analytics depth both matter.
7. Piwik PRO Analytics Suite
Piwik PRO is aimed at teams that treat consent, tagging, analytics, and customer data as one governed workflow. The suite combines web and app analytics with a Consent Manager, Tag Manager, and Customer Data Platform. It also offers EU-operated cloud options and HIPAA BAA availability on eligible plans, making plan eligibility part of the buying conversation rather than a detail to assume.
This structure suits regulated industries, public-sector organizations, and companies with complex lawful-collection requirements. Privacy isn't just a setting inside a report. It affects which tags fire, what data enters the platform, how long records remain available, and which downstream systems can use those records.
Pricing and feature limits can be confusing because plans are tied to actions. Teams should model expected collection, consent states, tag activity, and reporting requirements before comparing proposals. The platform also has fewer third-party tutorials than mass-market analytics tools, so internal documentation and implementation support matter.
Migration should document lawful collection states before rebuilding dashboards. Map tags to consent categories, identify what happens when visitors reject analytics, and clarify action-based limits and eligible compliance features. This work prevents a common failure mode, where a team migrates reports but leaves the underlying consent behavior undefined.
Implement Consent Manager and Tag Manager first. Then establish role-based access, retention policies, and tests across consent states. Rebuild only the reports that have clear owners and decisions attached to them. A structured approach to digital marketing tracking tools can help teams document the wider measurement stack around Piwik PRO.
Review Piwik PRO Analytics Suite if consent management and analytics governance need to live in the same operating model.
8. Plausible Analytics
Plausible is a focused choice for teams that need dependable website and campaign reporting without a full product-analytics suite. Its lightweight, privacy-focused approach centers on visits, sources, pages, custom events, and goals. Funnels, user journeys, and revenue tracking are available on Business tier and above, along with the API and Looker Studio connector at the relevant tier.
The interface is intentionally easier to explain than an enterprise workspace. That makes Plausible useful for marketing teams, content publishers, agencies, and clients who need a recurring view of acquisition and website performance without navigating a large event model.
The limitation is measurement depth. Plausible isn't designed for feature flags, experimentation, detailed product cohorts, or deep user-level behavioral analysis. Teams should not buy it expecting to reconstruct every GA4 exploration. Its value comes from narrowing the system to metrics people can interpret and act on.
Migration should translate only essential reports. Start with visits, sources, pages, goals, funnels, and revenue events. Use consistent UTM naming, verify consent and proxy choices, and decide whether a managed proxy fits the organization's technical and privacy requirements. Revenue reporting also needs a clear definition of which event represents value.
Best fit: Choose Plausible when the team wants a clean reporting layer, not another analytics engineering project.
Configure a small event and goal plan, then create one dashboard for recurring decisions. If a question requires retention, experimentation, or detailed behavioral paths, connect a specialized product tool rather than forcing Plausible beyond its design.
Visit Plausible Analytics for a lightweight reporting model grounded in privacy and first-party data practices.
9. Fathom Analytics
Fathom keeps the analytics model deliberately lean. It provides UTM and source reporting, page-level dashboards, events, a simple API, multi-site management, and ad-blocker bypass options. That combination works well for landing pages, content sites, agencies, and businesses that need a fast read on traffic and campaign activity without cohorts or experimentation.
Its pricing mechanic deserves close attention. Fathom uses per-pageview pricing, and event requests count as pageviews. A team that adds frequent interaction events without modeling the effect can increase its bill faster than expected. That doesn't make the model unsuitable, but it makes event planning part of financial planning.
Migration is straightforward if the business has modest reporting needs. Inventory pageviews across every site, preserve UTM conventions, identify which event requests will count toward billing, and decide whether separate site dashboards are needed. Then compare core metrics against the existing platform during a parallel period, while documenting differences in definitions.
The first configuration should stay narrow:
- Deploy the lightweight script: Keep the implementation limited to the required sites and environments.
- Define decision-critical events: Track actions that change marketing or content decisions.
- Create site dashboards: Separate client, brand, or property reporting where appropriate.
- Review billing exposure: Estimate the effect of high-volume interactions before adding them.
Fathom isn't a substitute for product analytics. It won't provide the same depth as Amplitude, Mixpanel, or PostHog. It's a strong alternative when simplicity, privacy, speed, and client-friendly reporting matter more than behavioral exploration.
See Fathom Analytics if you want simple multi-site reporting with a billing model tied directly to pageviews.
10. Simple Analytics
Simple Analytics works as a low-friction reporting layer for teams that need acquisition and page-performance visibility without a deep product-analysis environment. Its baseline uses no cookies and no personal data, with EU data residency. The one-page dashboard, team views, API, and exports make it accessible to non-analysts and useful as a second source alongside GA4 or Adobe.
That validation role is important. A lightweight tool can provide a separate view of traffic that helps teams identify whether a reporting change comes from the website, a consent configuration, or a platform-specific definition. It shouldn't be treated as a replacement for every downstream warehouse or product-analytics question.
Simple Analytics has fewer features for cohorts, experiments, and detailed product behavior. Higher-tier requirements can also introduce per-user charges, while enterprise needs such as SSO, SOC2, SLAs, proxy support, and Looker Studio connectivity need to be assessed against the selected plan.
Migration should start with a parallel comparison. Document differences in visitors, sources, pages, conversions, consent behavior, and time zones. Establish team views, API and export requirements, EU residency expectations, and a small set of checks that owners can repeat each reporting period.
A practical first setup includes:
- Source checks: Confirm that campaign parameters arrive with the expected naming.
- Page checks: Validate important landing pages, content groups, and conversion paths.
- Conversion checks: Compare a small number of business-critical actions with the existing system.
- Access checks: Give report owners the views they need without broadening permissions unnecessarily.
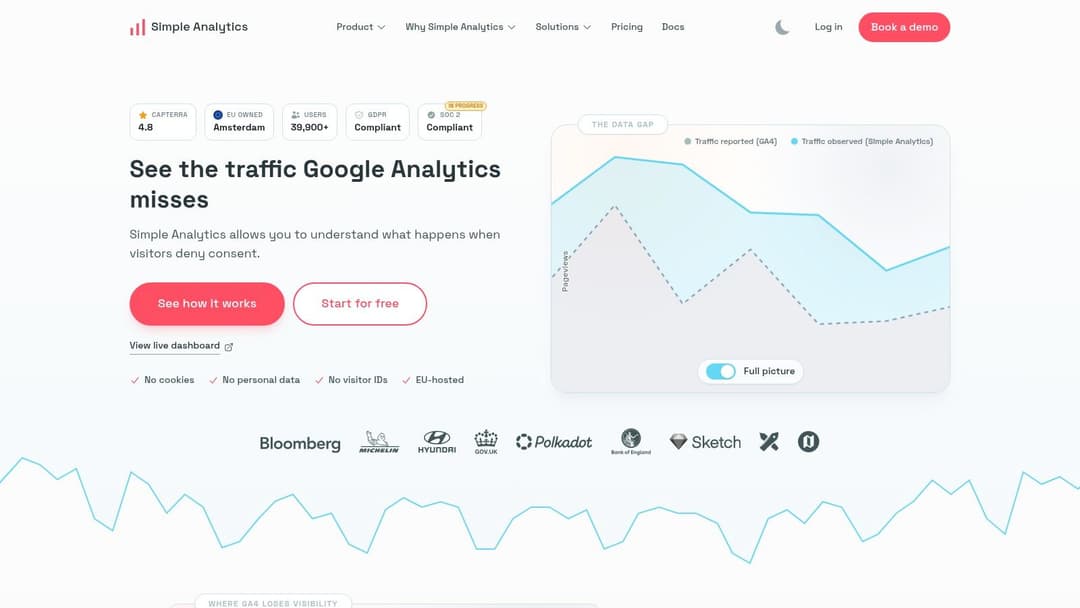
Explore Simple Analytics if clear reporting, EU residency, and independent validation matter more than advanced behavioral analysis.
Top 10 Google Analytics Alternatives, Comparison Matrix
| Product | Core focus & features | UX & scale | Best for (target audience) | Unique selling point | Pricing model / cost notes |
|---|---|---|---|---|---|
| Adobe Analytics | Enterprise digital analytics: segmentation, attribution, workspace, AEP integrations | Powerful but complex; heavy governance & implementation | Multi-site / multi-brand enterprises, centralized analytics teams | Deep customization, enterprise governance & cross‑channel integration | Quote-based; typically high TCO; implementation effort required |
| Amplitude Analytics | Product & web analytics: funnels, retention, session replay, experimentation, AI insights | Self-serve but learning curve; generous free tier | Product & growth teams tying acquisition to downstream behavior | Experimentation + analytics in one; AI-assisted analysis | Free tier; costs scale with MTUs/events; advanced features paid |
| Mixpanel | Event-based analytics: funnels, retention, flows, metric trees, replays | Strong self-serve UX; quick insights for teams | Growth/product teams needing rapid, actionable metrics | Transparent pricing calculator; templates for KPIs | Usage/event-based pricing; event overages can increase cost |
| Heap (by Contentsquare) | Autocapture product analytics: automatic events, journey maps, conversion friction | Rapid onboarding; can create noise, needs governance | Teams that need retroactive insights without heavy instrumentation | Automatic event capture enabling retroactive analysis | Sales-assisted pricing; evaluate capture volume & controls |
| PostHog | All-in-one analytics: autocapture, replays, feature flags, experiments, error tracking | Developer-friendly; cloud or self-host; free tiers available | Engineering-led teams wanting single operational stack | Self-host option and open-source roots; unified toolset | Transparent usage pricing; free tiers; event billing can spike |
| Matomo (Cloud & On‑Premise) | Privacy-first analytics: ecommerce, funnels, heatmaps, session recording, GA importer | Feature-rich but steeper UI; on‑premise requires ops | Teams needing data ownership, residency control, on‑prem options | No sampling; full data ownership and privacy controls | Cloud pricing scales by hits; on‑premise requires maintenance |
| Piwik PRO Analytics Suite | Analytics + Tag Manager + Consent Manager + CDP for regulated industries | Suite approach for compliance; setup and role governance needed | Regulated sectors (public sector, healthcare, finance) | Built-in consent management, HIPAA BAA options, EU cloud | Action-based limits; sales-assisted pricing; tier complexity |
| Plausible Analytics | Lightweight, privacy-focused web analytics: visits, sources, events, funnels (Business) | Very simple UI; minimal script; fast page performance | Marketers & sites needing simple, privacy-first campaign reporting | Cookieless, lightweight script; privacy-by-design | Tiered plans; Business tier unlocks funnels, API, revenue |
| Fathom Analytics | Privacy-first, cookieless web analytics with per-pageview billing | Extremely lean and fast; limited depth for behavioral analysis | Landing pages, content sites, client-facing reporting | Ad-block resistant, simple per-site dashboards | Per-pageview pricing; events may count as pageviews (billing) |
| Simple Analytics | One-page, cookieless dashboard; EU-hosted; raw export & integrations on higher tiers | Very simple for non-analysts; low-friction validation tool | Teams needing clear, privacy-friendly reporting or GA4 validation | EU data residency, simple UI, privacy-first export options | Tiered pricing; per-user charges on some plans; enterprise options |
Make the Switch Without Losing Your Baseline
The right tool depends on the measurement model, not the popularity of the vendor. Adobe Analytics is strongest for enterprise governance and cross-channel customization. Amplitude, Mixpanel, Heap, and PostHog are better aligned with product behavior and experimentation. Matomo and Piwik PRO offer stronger control over privacy, consent, and deployment decisions. Plausible, Fathom, and Simple Analytics make more sense when the job is lightweight web and campaign reporting.
Before choosing, separate measurement depth from data ownership. A self-hosted platform may give you infrastructure control but require operational support. A privacy-first hosted platform may reduce implementation effort but provide fewer user-level or product-analysis features. A product analytics platform may answer retention questions while leaving campaign revenue attribution dependent on other systems.
Use the comparison table to narrow the field, then validate the shortlist against your own implementation reality. Pricing mechanics deserve the same attention as feature lists. Quote-based plans, action limits, event billing, pageview billing, and higher-tier exports can all change the total cost of ownership.
The migration itself should follow a controlled sequence:
- Define the decisions: Write down what analytics must support, such as budget allocation, funnel improvement, product adoption, compliance reporting, or revenue reconciliation.
- Inventory the current system: Record tags, events, goals, audiences, UTMs, consent states, integrations, warehouse exports, and report owners.
- Choose the architecture: Select one primary tool and decide whether a validation layer, product tool, warehouse, or ad-platform reporting system is also required.
- Document privacy requirements: Set retention, deletion, residency, access, consent, and data-minimization rules before deployment.
- Create a shared taxonomy: Standardize event names, properties, campaign parameters, identities, conversion definitions, and ownership.
- Run systems in parallel: Compare key reports rather than expecting identical totals.
- Reconcile important metrics: Explain differences in users, sessions, events, conversions, revenue, attribution, and consent coverage.
- Train report owners: Make sure marketers, product managers, analysts, and executives know which reports to use and how definitions differ.
- Remove legacy tracking last: Retire old tags only after the new implementation is stable, documented, and trusted.
Performance marketers also need to protect the connection between analytics and advertising decisions. Your chosen analytics platform can explain website and product outcomes, while AdStellar AI can use Meta campaign data to rank creative, audience, and message performance against goals such as ROAS, CPL, or CPA. Match each system to the decisions it can measure well, then connect the outputs through a shared taxonomy instead of forcing one platform to do everything.
AdStellar AI helps Meta campaign teams generate creative, copy, and audience combinations, launch campaigns, and use performance data to identify stronger-performing elements. Visit AdStellar AI to connect ad operations with a more disciplined analytics workflow.