Let's cut through the noise: while the classic benchmark for Facebook Ads CTR often sits around 0.9%, modern data shows high-performing campaigns are hitting 1.5% to 3.0%—and sometimes much higher. This single metric is one of the most powerful signals you have for your ad's relevance and creative punch.
What Is a Good Facebook Ads Click Through Rate?
Think of your ad's click-through rate (CTR) like a storefront window display on a busy street. A low CTR means people are just scrolling past without a second glance. But a high CTR? That’s your sign that the display is compelling enough to pull people inside for a closer look.
It’s the first and most direct measure of how well your creative and targeting are actually connecting with your audience. But what number should you really be aiming for? The answer isn't a single magic figure. It’s a range that shifts depending on your goals, your industry, and how you’re measuring it.
The Old Standard Versus New Reality
For years, the industry has leaned on a baseline average of around 0.90%. This meant that for every 1,000 people who saw an ad, you could expect about 9 clicks. Simple enough.
However, more recent agency data—which looks at median performance instead of a simple average—paints a much more ambitious picture. This is key because medians are less skewed by tons of low-budget, unoptimized campaigns, giving a clearer view of what actively managed accounts can achieve.
So, while you'll still see reports citing 0.9% to 1.8% as the general range, the reality on the ground for performance-focused marketers is different. The median CTR is now hovering closer to 1.80%, which tells us that a lot of advertisers are blowing past that old 0.90% standard.
To give you a clearer picture of what to aim for, here’s a quick breakdown:
Facebook Ads CTR Benchmarks At a Glance
| Benchmark Type | Average CTR | What It Means for Marketers |
|---|---|---|
| Legacy Average | ~0.9% | The classic, conservative baseline. If you're below this, your ads likely need immediate attention. |
| Modern Median | ~1.8% | A more realistic benchmark for actively managed campaigns. This is a solid, achievable target for most. |
| High-Growth Goal | 1.5% - 3.0%+ | The target range for aggressive performance marketing teams aiming for top-tier efficiency and scale. |
This shift is crucial for performance marketers. While 0.9% is a good "canary in the coal mine" metric, a well-optimized e-commerce or lead generation campaign should realistically be targeting a CTR somewhere between 1.5% and 3.0% on core audiences.
Why Small CTR Gains Have a Huge Impact
The difference between a "decent" CTR and a "good" one isn't just a vanity metric—it has a massive impact on your bottom line.
For instance, lifting your CTR from a standard 0.9% to a strong 1.5% isn't a minor tweak. It's a 66% increase in traffic for the exact same ad spend.
This efficiency creates a powerful ripple effect through your entire funnel:
- Lower Costs: A higher CTR signals to Meta's algorithm that your ad is relevant, which often leads to a better Quality Score. The reward? Lower cost per click (CPC) and cost per mille (CPM).
- More Qualified Leads: A compelling ad that earns the click is the first step in filling your funnel with users who are genuinely interested in what you have to offer.
- Improved ROAS: Getting more traffic for the same budget directly contributes to a healthier return on ad spend (ROAS) and a lower cost per acquisition (CPA).
Understanding these benchmarks is essential for setting realistic goals and diagnosing problems, especially when you factor in the overall cost of social media marketing. A strong CTR is your first indicator that your ad creative, copy, and audience targeting are all working together perfectly.
Finding Your True CTR Benchmark by Industry
Comparing your Facebook ad CTR to some generic, global average is like comparing an apple to a forklift. It’s a useless comparison. Why? Because a one-size-fits-all benchmark is seriously misleading when user intent and psychology shift so dramatically from one industry to another.
Think about it. It’s a lot easier to get someone to click on an ad for a new pair of sneakers than it is for niche B2B software. One is a visually-driven, low-commitment click; the other is a high-intent, complex decision. This gap isn't a sign of bad marketing—it’s just market reality. To set goals that actually make sense, you need to measure your performance against your direct competitors, not some random number that doesn’t apply to you.
This chart shows just how much our thinking about "average" CTR has changed, moving from a legacy baseline to a much more ambitious high-growth target.
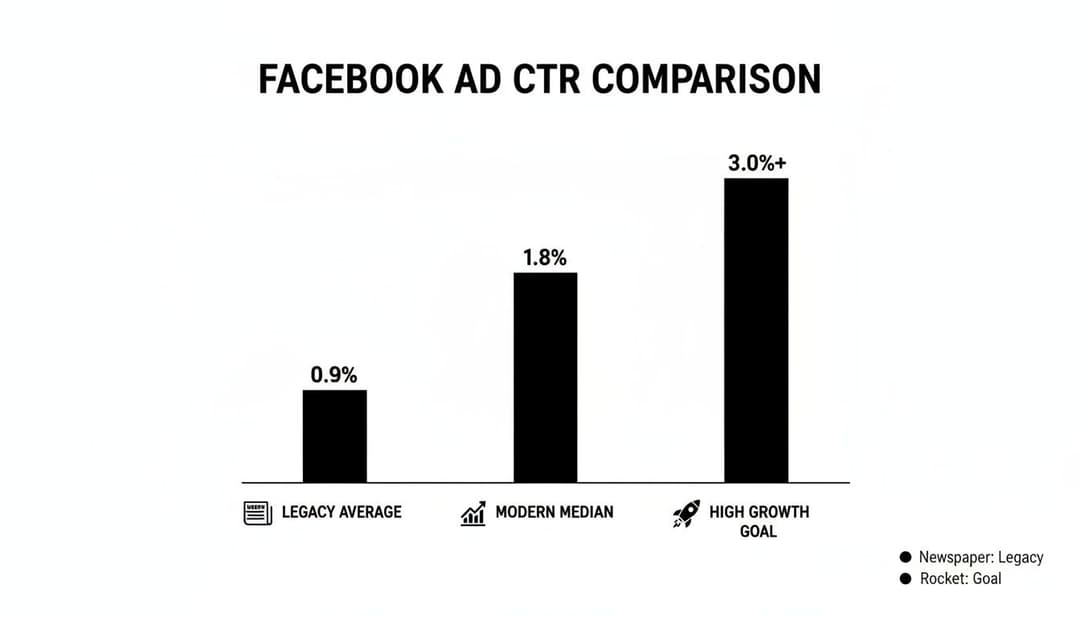
As you can see, while 0.9% was the classic baseline for a long time, modern campaigns are more realistically measured against a 1.8% median. Top performers are consistently pushing past 3.0%.
How Industry Shapes Your CTR Expectations
The numbers tell the real story: your industry vertical is one of the biggest factors dictating your expected CTR. A B2B services company pulling a 0.78% CTR might be crushing it, while a retail brand with the same number would be lagging. It all boils down to the complexity of the offer and the audience’s mindset at that moment.
Performance data consistently shows that visually driven and high-intent industries blow the old 0.90% all-industry average out of the water. Legal services, for instance, see an average CTR of 1.61%, while retail is right there with them at 1.59%.
This is exactly why a retail brand can reasonably aim for a 1.5%–2.0% CTR with a solid campaign. Meanwhile, a B2B SaaS marketer hitting 0.8%–1.2% is likely doing very well, especially in a crowded feed. More recent data from other sources backs this up, showing apparel and footwear leading the pack globally with a 2.06% Facebook CTR—proving just how much impulse-friendly products drive engagement.
For any serious performance marketer, this means you absolutely must use vertical-specific benchmarks. A platform like AdStellar AI, for example, is built to understand this context. It learns the expected CTR ranges for different industries and can flag when something is a real outlier. A 1.6% CTR for a B2B campaign could be a sign of a breakout creative. That same 1.6% in the apparel industry? It might just be par for the course. You can learn more about where to find ad performance data to build your own benchmarks in our detailed guide.
The Three Levers That Control Your Ad CTR
Ever wonder why some of your Facebook ads get all the clicks while others just… don’t? It’s not a mystery, and it’s definitely not luck. Your ad’s performance really boils down to three core components. When you master these three "levers," you can diagnose a weak CTR and start systematically turning things around.
Think of your ad campaign like a high-performance engine. For it to run smoothly and generate real power (clicks!), three parts have to work in perfect sync. If one is off, the whole system sputters. Those parts are your ad creative, your ad copy, and your audience targeting.

1. Ad Creative: The Scroll Stopper
Your ad creative—the image, video, or graphic—has one job in a fast-moving feed: stop the thumb. It’s the very first thing people see, and a blurry, uninspired, or totally irrelevant visual is an instant-fail.
Let’s say an e-commerce brand is selling vibrant running shoes. A static, boring product photo might limp along at a 0.5% CTR. But swap that for a dynamic video of a runner on a scenic trail, or a carousel showing off different colorways? You could easily double or triple that click-through rate.
Your creative is your first impression. It has to be compelling enough to earn more than the one second a user typically spends scanning a post. If it fails, nothing else matters.
2. Ad Copy: The Curiosity Hook
Once the creative has done its job and stopped the scroll, the ad copy takes over. This is your headline and primary text, and its role is to spark curiosity and push someone to act. Great copy is the bridge that connects your visual to the user's actual needs or desires.
Weak copy is generic and forgettable (e.g., "Shop Our New Sale"). Strong copy hits a nerve by speaking directly to a pain point or aspiration (e.g., "Tired of shoes that quit before you do?"). Honing your skills in crafting effective ad copy is one of the fastest ways to drive more clicks.
Even a simple shift in your headline can produce wildly different results. Testing a question against a benefit-driven statement can tell you exactly what makes your audience tick, giving your metrics a serious lift.
3. Audience Targeting: The Relevance Engine
This final lever is arguably the most powerful: audience targeting. You can have the world's best creative and copy, but if you show it to the wrong people, your CTR will be abysmal. It all comes down to relevance.
Imagine you're advertising a high-end steakhouse. Showing that ad to a broad audience that includes vegans is just burning impressions and money. But what if you target users who’ve shown interest in fine dining, follow celebrity chefs on Instagram, or live within five miles of your restaurant? That’s how you find relevance and drive a high CTR.
An ad shown to a "warm" audience of past website visitors might pull in a 3-5% CTR. The exact same ad shown to a "cold" prospecting audience could be closer to 1%. This is why understanding your audience—and using Facebook's tools to reach them precisely—is absolutely non-negotiable for a healthy average click through rate for Facebook ads.
For a deeper dive into this, our guide on how to improve click-through rate has even more actionable tactics you can use.
Turning Performance Data into Actionable Insights
Watching your metrics is one thing; actually using them to make your ads better is a completely different ballgame. To really level up your optimization skills, you need to stop staring at surface-level numbers and start segmenting your data in Facebook Ads Manager to find the hidden gold.
A campaign with a mediocre 1% CTR might look like a dud on paper. But that single number could be hiding a rockstar 4% CTR on Instagram Stories and a dismal 0.2% CTR on another placement. If you don't dig deeper, you're just throwing money away without knowing which parts of your campaign are actually working. This is where data stops being a report card and becomes your roadmap.

Spotting Creative Fatigue Early
One of the biggest culprits behind a tanking CTR is creative fatigue. It’s what happens when your audience has seen your ad so many times they’ve gone blind to it. The key is catching the warning signs before your performance completely falls off a cliff.
We've seen it time and time again: once an ad's frequency—the average number of times a user sees it—hits just 2 impressions, the CTR can drop by nearly 9%. At the same time, the CPC can shoot up by almost 50%. Think about that. The same budget buys you far fewer engaged clicks after people have seen the ad just a couple of times.
Your ad frequency is the canary in the coal mine. When you see it creeping past 2 or 3 for a specific ad set, it’s a massive red flag. That’s your signal to get fresh creative in there, pronto.
A Framework for Smart Optimization
Stop making decisions based on gut feelings. A structured process for pausing the duds and doubling down on the winners is what separates the pros from the amateurs. By systematically breaking down your campaigns, you ensure every dollar is flowing to the creative and audiences that actually deliver.
Here’s a simple, step-by-step framework to get you started:
- Segment Your Data: Pop open Ads Manager and use the "Breakdown" feature. Slice your data by Placement, Age, Gender, and Device. This is how you uncover those hidden winners and losers.
- Identify Underperformers: Hunt for ads or ad sets with a CTR that's way below your campaign average and a Cost Per Result that's making you cringe. These are the first ones on the chopping block.
- Find Your Winners: Now, find the ads, placements, and audiences that are crushing your benchmarks. These are the combinations you want to pour fuel on.
- Reallocate and Test: Pause the failing ads and immediately shift that budget over to your top performers. Then, use what you’ve learned from your winners to create new ad variations to test against them.
This loop of analyzing, acting, and testing is the heart of great campaign management. For a more detailed walkthrough, our guide on how to analyze ad performance dives even deeper into turning raw numbers into smart decisions. This constant cycle of learning and optimizing is what turns average campaigns into exceptional ones.
Advanced Strategies to Systematically Boost Your CTR
Once you've nailed the fundamentals, bumping up your CTR is less about throwing spaghetti at the wall and more about building a repeatable system. This is where we move beyond simple A/B tests and into a more structured, methodical approach that lets you find breakout ads faster and scale your winners with total confidence.
The goal here is to create a constant feedback loop. Data from one test should directly inform the next, systematically pushing your average CTR higher and higher. You're not just looking for a single lucky ad; you're building an engine for continuous improvement.
Implement Structured Creative Testing
Instead of randomly swapping headlines and images hoping for a win, a structured approach isolates one variable at a time. This gives you crystal-clear, actionable learnings and forms the bedrock of any serious optimization process.
For example, you might start by testing three completely distinct creative concepts against your best-performing audience. The goal is just to find a winning visual theme. Once you've identified that winning creative, you lock it in. Then you test three different headlines against it. This methodical process tells you exactly which element is driving the performance lift. If you really want to go deep on this, understanding the principles of what is multivariate testing is a solid next step.
Leverage Meta's Dynamic Creative
Why manually test every possible ad combination when Meta’s own AI can do the heavy lifting for you? Dynamic Creative is an incredibly powerful tool that lets you upload a whole menu of ad components and let the algorithm figure out the best-performing combinations for each individual user.
You could provide it with:
- 5 different images or videos showing your product from various angles or in different use cases.
- 3 unique headlines that hit on different benefits or customer pain points.
- 2 distinct calls-to-action to see what truly motivates a click.
Meta’s system then gets to work, mixing and matching these assets on the fly and automatically shifting budget toward the combinations that rack up the highest CTR. It’s like having a super-powered testing assistant running thousands of micro-experiments for you.
By leaning on Dynamic Creative, you are essentially outsourcing the heavy lifting of combination testing to an AI that can analyze thousands of signals in real-time to optimize your ad delivery.
Harness the Power of UGC and Lookalikes
Nothing builds trust and stops the scroll faster than authentic social proof. User-generated content (UGC)—think customer reviews, unboxing videos, or photos of people genuinely loving your product—feels real. It instantly cuts through the noise of polished, professional brand ads.
Time and time again, campaigns built around genuine UGC see a significant lift in CTR. Why? Because they feel less like an ad and more like a trusted recommendation from a friend.
Now, pair that potent creative with a sophisticated audience strategy. Start by creating Lookalike Audiences based on your most valuable customer lists—people who are repeat buyers or those with the highest lifetime value. By showing authentic UGC to an audience that Meta has algorithmically modeled after your very best customers, you create a perfect storm of relevance and trust. Clicks are almost guaranteed to follow.
For more advanced tactics to get your numbers up, this article provides some excellent strategies to improve your click-through rate.
Answering Your Toughest Facebook Ad CTR Questions
As you start digging into your campaign data, you’re bound to run into some tricky situations. Let’s tackle a few of the most common questions that come up when you're in the trenches, trying to make sense of your CTR.
Is a High CTR Always a Good Thing?
Not necessarily. While a high CTR feels great—it means your ad is grabbing attention and getting people to act—it can easily become a vanity metric if those clicks aren't turning into actual business.
Think about it: an ad with a stellar 5% CTR that generates zero sales is a waste of money. This scenario usually points to a major disconnect between what your ad promises and what your landing page delivers. The user was intrigued enough to click, but something on the other side immediately let them down.
The goal isn't just to get any click; it's to attract the right clicks from people who are genuinely likely to convert. Always look at your CTR next to your cost per acquisition (CPA) and return on ad spend (ROAS) to get the complete picture.
Why Did My Facebook Ad CTR Suddenly Drop?
A sudden nosedive in your CTR is almost always a textbook case of ad fatigue. This is what happens when your audience has seen your ad so many times they've just started to tune it out. They've gone "ad blind" to your creative.
The first place you should look is your ad's Frequency metric. If that number is creeping up, especially past 3 or 4, it's a huge red flag that your creative has gone stale. Time for a refresh.
A few other culprits could be at play:
- New Competitors: Someone new might have jumped into the auction, making it more crowded and pushing your ad down.
- Seasonal Shifts: People's online habits change with the seasons, which can ripple out and affect how they engage with ads.
Your best first move is to launch some new ad variations. Fresh copy and visuals can often reignite that initial spark and pull your numbers back up.
Does My Campaign Objective Affect My Expected CTR?
Absolutely. This is a big one. The campaign objective you choose tells Meta's algorithm exactly what kind of person to hunt for, which has a massive impact on the CTR you should expect. You can't compare a Traffic campaign's CTR to a Conversions campaign's CTR—it's apples and oranges.
When you set your objective to "Traffic" or "Engagement," you're telling Meta, "Go find me the clickers and the likers!" The algorithm then prioritizes showing your ad to people who have a history of clicking, liking, and sharing content. Naturally, this leads to a higher CTR.
On the other hand, a "Conversions" or "Sales" campaign is going after a much smaller, more selective group: the people Meta thinks are most likely to actually buy something. The algorithm is optimizing for conversion quality, not click quantity. This usually means a lower CTR, but the traffic you do get is far more valuable and high-intent. Always benchmark your performance against other campaigns running the same objective.
Ready to stop guessing and start scaling? AdStellar AI automates the entire ad creation, testing, and optimization process, letting you launch hundreds of ad variations in minutes and find your next winning campaign 10x faster. Discover how AdStellar AI can transform your Meta ad performance.