You launch a new creative test, check Instagram a few hours later, and the dashboard looks busy. Views are moving. Likes are coming in. A few comments look promising. Follower count nudges up.
But the hard question still sits there. Which of these numbers matters for growth, and which ones just make you feel better for a minute?
In this scenario, marketers often get stuck on Instagram insight meaning. They have access to data, but not a working model for interpreting it. Instagram Insights can feel like a pile of labels rather than a system. Reach. Impressions. Accounts Engaged. Watch Time. Profile Activity. Useful, yes. Obvious, no.
A better way to use Insights is to treat it like pre-campaign research. Organic performance tells you what earns attention, what creates intent, and what deserves paid budget. When you read the dashboard that way, Instagram stops being a vanity channel and starts becoming a low-cost testing environment for Meta ads.
Beyond Likes The Real Meaning of Instagram Analytics
A lot of smart marketers still read Instagram backwards.
They open a post, see strong likes, and assume the content worked. Then they boost a similar asset, send spend behind it, and wonder why the campaign underperforms. The problem usually isn’t the creative itself. It’s the interpretation.
Likes are a reaction. Strategy needs signals with context.
What the dashboard is really telling you
Instagram Insights isn’t a report card. It’s a map of audience behavior.
It shows three things that matter far more than surface engagement:
- How many distinct people saw the content
- What they did after seeing it
- Whether that behavior suggests future buying intent
That’s why a post with modest likes can still be a stronger ad candidate than the flashy winner in your feed.
A simple example helps. Say one carousel gets fewer comments than a Reel, but drives more profile visits and saves. The Reel may be entertaining. The carousel may be more commercially useful. If you care about efficient spend, that difference matters.
Practical rule: Don’t ask, “Did people like this?” Ask, “Did this move people one step closer to action?”
That shift is the core of instagram insight meaning for performance teams.
Vanity metrics vs directional metrics
This presents a cleaner approach:
| Metric type | What it often tells you | Why it matters |
|---|---|---|
| Likes | Light approval | Good to note, weak on intent by itself |
| Comments | Conversation or controversy | Useful when comment quality is strong |
| Saves | Future value | Often points to durable, reusable creative angles |
| Profile visits | Curiosity with intent | Strong bridge between content and conversion path |
| Website taps | Action | Closest on-platform sign of lower-funnel interest |
If you need a sharper foundation on visibility metrics before going deeper, this breakdown of what impressions mean on Instagram helps clarify one of the most common points of confusion.
The useful marketer doesn’t stare at the dashboard longer. They ask better questions of it.
What Are Instagram Insights and Where to Find Them
Instagram Insights is Instagram’s built-in analytics tool for professional accounts, meaning Business and Creator accounts. If you’re using a personal profile, you won’t get the full dashboard.
That distinction trips people up more often than it should. They know the data exists, but don’t realize access depends on account type.
How to open Instagram Insights
On mobile, the path is straightforward:
- Go to your Instagram profile
- Tap Professional dashboard or the menu icon in the top corner
- Tap Insights
From there, Instagram shows overview-level account data plus content-level analytics for posts, Stories, Reels, and Lives.
If you don’t see those options, switch your account type first. Inside account settings, Instagram lets you change from personal to professional and choose either creator or business.
What you’ll find inside
The main dashboard usually gives you quick access to:
- Accounts reached
- Accounts engaged
- Total followers
- Content performance
- Profile activity
Then, when you tap into an individual post or Reel, you get item-specific data.
That structure matters because not all insights answer the same question. Account-level metrics tell you what your overall presence is doing. Post-level metrics tell you which asset earned attention. Those are related, but they’re not interchangeable.
Why access matters for campaign planning
If you run Meta ads, Instagram Insights should sit next to Ads Manager in your workflow, not somewhere below it.
Use Insights to identify winning topics, hooks, and audience patterns before you formalize them in paid campaigns. Use Ads Manager to validate what scales under budget and targeting constraints. Teams that already work in Meta Business Suite will recognize the overlap. The difference is that Instagram Insights often surfaces creative signals earlier, especially for organic-first brands.
The fastest way to waste paid budget is to promote content you never actually evaluated beyond likes.
Instagram gives you the raw material. Your job is to convert it into decisions.
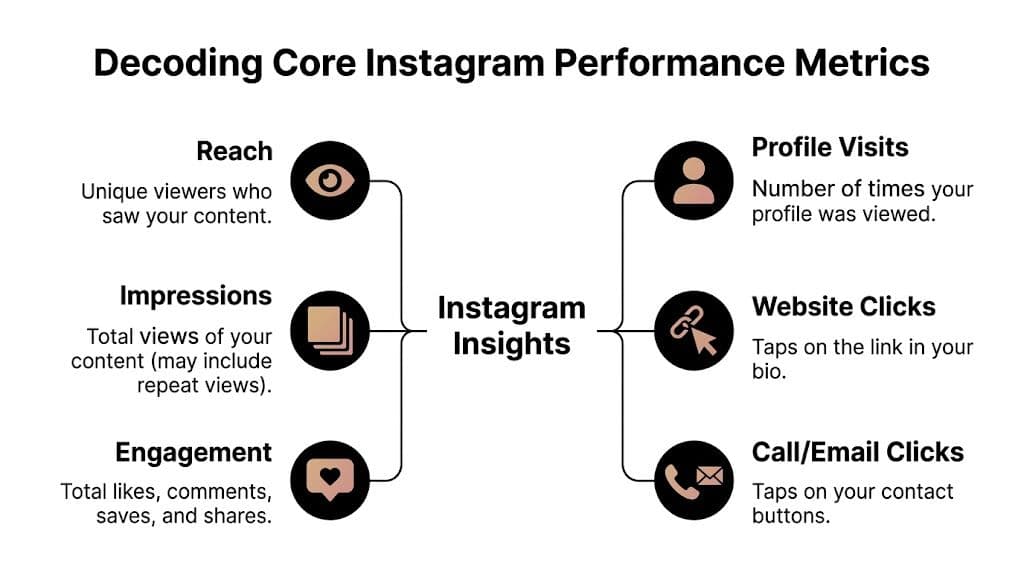
Decoding Core Performance Metrics
A post can rack up views, spark a wave of saves, and still be a poor candidate for paid spend. Another post can reach fewer people organically but send a strong share of viewers to your profile or site, which often makes it more valuable for revenue. That gap is why Instagram Insights matters. The raw numbers are easy to see. The job is deciding which numbers signal scale, which signal intent, and which only signal surface-level attention.
Reach vs Impressions
Reach measures unique accounts. Impressions measure total views, including repeat views from the same person.
A theater comparison helps here. Reach is the number of people who walked into the room. Impressions are the number of times seats were occupied, even if the same person came back for another showing. If one person sees your Reel three times, Instagram records one reached account and three impressions.
Flaminjoy’s explanation of Instagram Insights states that Reach counts unique accounts, while Impressions count total views, and notes that an Impressions-to-Reach ratio above 3:1 can indicate repeated distribution tied to higher engagement rates in some markets. Useful signal. Not automatic proof of quality.
For a performance marketer, this metric pair answers two different questions:
- Reach asks: how wide did this message travel?
- Impressions asks: how often did people see it?
That difference matters when you evaluate creative for paid social. High reach suggests discovery potential. High impressions relative to reach suggest frequency. In organic, frequency can mean the algorithm kept serving the asset. In paid, the same pattern can become fatigue if click-through rate drops and CPM rises.
What Reach means for scaling
Reach is one of your best early clues that a post can travel beyond your current audience.
If a post reaches far more people than your follower count would suggest, Instagram is giving it distribution outside your core base. That usually means the opening hook, topic, or format has broader appeal. For campaign planning, that is often a better signal than likes because paid acquisition depends on cold audience response, not follower familiarity.
Flaminjoy also notes that strong e-commerce Reels can produce favorable Reach-to-Follower ratios and that hashtag-driven discovery can expand distribution. The strategic point is simpler than the exact benchmark. If organic reach comes from non-followers, you may have a creative angle worth testing in prospecting.
Organic data starts feeding paid strategy. A Reel that consistently earns non-follower reach gives you a candidate for top-of-funnel ads. A tool like AdStellar AI can then help turn that signal into a structured testing plan instead of boosting the post and hoping for efficient ROAS.
Understanding Accounts Engaged
Accounts Engaged tracks unique people who took some form of action on your content. That can include likes, comments, shares, saves, replies, profile visits, and link taps, depending on the format and placement.
This metric matters because it filters out passive exposure. A view says someone had the chance to notice you. Engagement says they reacted.
That distinction clears up a common mistake. Two posts can have similar reach, but the one with more engaged accounts usually has stronger message-market fit. It gave people a reason to do something, not just scroll past a thumbnail and linger for a second.
Use engaged accounts to compare assets fairly. If Post A reaches 1,000 accounts and 100 engage, while Post B reaches 4,000 and 120 engage, Post B looked bigger on the surface. Post A created denser response. For paid creative testing, denser response often makes the better starting point because it suggests the concept is resonating, not just getting incidental distribution.
Profile Activity and commercial intent
Profile Activity is where Instagram starts getting closer to business value.
Likes and comments matter, but they sit higher in the funnel. Profile visits, follows, website taps, and contact actions show a stronger level of consideration because the user is choosing to leave the content unit and learn more about the brand. That behavior is closer to the actions performance teams care about downstream.
Profile Activity usually includes:
- Profile visits
- Follows
- Website taps
- Calls or contact actions
Read those actions in order of intent. A like is light feedback. A save often signals utility. A profile visit suggests curiosity. A website tap suggests commercial interest.
If your organic post produces modest engagement but unusually high profile visits, do not dismiss it. That pattern often means the creative is doing a strong job of qualifying interest. In paid social, that can translate into an effective prospecting ad, especially if the landing page and offer match the promise of the post.
A practical way to read the metrics together
Single metrics are easy to overvalue. Combinations are more useful.
Use a simple sequence: exposure, response, intent, action.
- High Reach, low engaged accounts suggests the hook earned attention, but the content did not create enough response to justify aggressive scaling.
- Moderate Reach, high saves and shares often points to educational or problem-aware creative that can work well in retargeting.
- High profile visits suggests the post created curiosity strong enough to move people one step closer to evaluation.
- High Impressions relative to Reach suggests repeated exposure. In paid campaigns, monitor that pattern closely so frequency does not outpace interest.
That is the mindset behind strong measurement. You are not collecting Instagram metrics for reporting decoration. You are building a shortlist of creative signals that can survive contact with budget, targeting, and conversion pressure. If you want a wider framework for judging those signals once they enter media buying, this guide to performance marketing metrics for paid acquisition is a useful companion.
Don’t judge content by the loudest metric. Judge it by the path it creates from attention to intent.
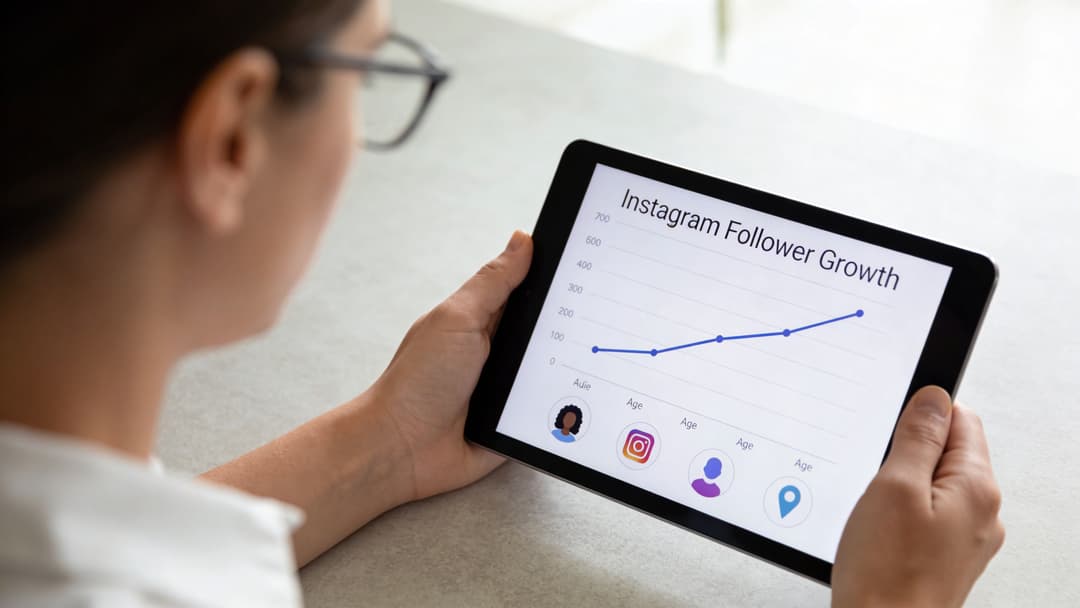
Analyzing Your Audience and Follower Growth
You publish a post that gets solid engagement. Then you launch ads to a broader audience, and performance drops. The creative did not suddenly get worse. The audience likely changed.
That is why follower data matters. It helps you verify whether the people responding organically resemble the people you plan to target with budget.
Inside the Total Followers area, Instagram shows patterns such as age, gender, location, and active times once the account has enough followers to surface audience data responsibly, as noted earlier. That turns “our audience seems to like this” into something you can use in planning.
What to look for in follower data
Start with the obvious fields, then push one level deeper.
- Top locations show where interest is concentrated
- Age ranges help you adjust voice, offer framing, and examples
- Gender split can reveal a gap between your intended audience and your actual audience
- Active times help you choose publishing windows that give strong posts a better chance of early traction
The mistake is treating those fields like audience trivia. They are targeting inputs.
If a large share of engaged followers comes from a few cities or countries, test those geos first in paid campaigns. If younger segments save educational posts while older segments respond to product demos, split the creative instead of forcing one message across everyone. That is the practical overlap with audience segmentation for paid and organic strategy.
One audience signal that deserves more attention
Follower growth is not just a vanity number. It works like a direction-of-fit check.
A spike after educational content often means you attracted people still in the problem-aware stage. A spike after product content can mean stronger commercial intent. A spike after founder-led content may signal that trust or point of view is doing more work than the offer itself. Each pattern suggests a different ad strategy, different landing page expectations, and a different path to ROAS.
There is also a useful organic distribution clue here. If your post appears to reach a large share of existing followers through the home feed, that usually means the message connected with your warm audience quickly. Treat that as an encouraging signal, not automatic proof that the creative is ready for scale. Warm-feed resonance and cold-audience conversion are related, but they are not the same job.
Here’s a practical walkthrough of audience analysis in action:
Turning follower growth into action
Follower growth becomes useful when you pair it with content type and downstream behavior.
Ask:
- Which posts brought in new followers?
- What format caused the lift. Carousel, Reel, Story, or static image?
- Did those posts attract the same audience you want in paid acquisition?
- Did follower spikes later correlate with profile visits, site clicks, or stronger retargeting performance?
That last question matters most for media buyers. Organic growth can act like a low-cost testing layer. If a certain topic consistently attracts the right audience and keeps them engaged, it may deserve budget. Platforms like AdStellar AI can help connect those organic signals to scalable ad decisions by surfacing which creative themes, hooks, and audience angles are worth testing under conversion pressure.
If audience insight points one way and your ad targeting points another, the account is flagging a mismatch before you spend into it.
This is the meaning. Audience analytics help you reduce wasted spend by aligning message, segment, and timing before the campaign has a chance to miss.
Decoding Story and Reel Specific Metrics
Marketers still overvalue likes on short-form content.
That mistake is expensive because Stories and Reels produce a different kind of signal. They tell you about attention, pacing, and retention. Those are often better predictors of ad performance than visible engagement.
Story metrics that reveal friction
Stories move fast, so small drop-offs matter.
The common metrics include:
- Impressions, which show how many times the Story was seen
- Reach, which shows unique viewers
- Exited, which indicates people left the Story sequence
- Replies, which show direct response
The key is interpretation. A high exit count doesn’t automatically mean the Story failed, but it does mean something caused people to stop. Maybe the frame was too dense. Maybe the opening lacked context. Maybe the offer appeared too late.
When exits spike on a specific frame, review that frame first. Don’t blame the whole sequence.
Reels metrics matter more than most people realize
For Reels, Plays are useful, but they’re incomplete. A play tells you someone started. It doesn’t tell you whether they stayed.
The stronger metrics are:
- Average Watch Time
- Total Watch Time
Those are closer to quality signals because they show whether the creative held attention after the first impression.
According to this creator benchmark discussion on YouTube, an average watch time over 15 seconds can double the probability of feed promotion. The same source says Reels drove 40% of Meta ad conversions in e-commerce in Q4 2025, and that AI analysis found a 70% viewer drop-off in the first 3 seconds predicts less than 1% ROAS.
That should change how you review creative.
If a Reel gets decent likes but weak watch time, don’t assume it’s a winner. It may be socially acceptable content that still fails as a scalable ad. If the first three seconds lose most viewers, the opening hook probably won’t survive paid distribution either.
A better review process for Reels
Use this order when you audit a Reel:
Check the opening
Does the first moment create enough curiosity to earn another second?
Review average watch time
If viewers don’t stay, the algorithm gets less reason to keep distributing it.
Look at total watch time
This helps you judge whether the asset is creating meaningful attention at scale.
Then review likes, shares, and saves
Those still matter, but they should come after attention metrics.
Strong Reels don’t just attract clicks. They keep people in the frame long enough for the platform to trust distribution.
For performance marketers, that’s the takeaway. Watch time isn’t just a content stat. It’s a creative screening tool.
Translating Insights into High-Performing Ad Campaigns
The biggest mistake teams make with organic content is treating it as separate from paid.
It isn’t. Organic Instagram is your cheapest testing environment for hooks, formats, audience reactions, and purchase-adjacent behavior. If you read Insights correctly, you can remove a lot of guesswork before a campaign ever launches.

How to pick organic winners for paid
Don’t choose ad candidates based on vanity popularity alone.
A better filter looks like this:
| Organic signal | What it suggests | Paid use case |
|---|---|---|
| High saves | The content has lasting value | Cold audience education or retargeting |
| High profile visits | The creative sparks curiosity | Prospecting with strong landing-page continuity |
| Strong watch time on Reels | The hook and pacing work | Video ad testing |
| Consistent follower engagement from a location cluster | Geographic demand is visible | Geo-specific ad sets |
A post that earns saves often contains an angle people want to revisit. That’s a strong sign the message has utility, not just novelty. In paid social, utility tends to travel well.
A Reel with strong retention is another candidate. If people stay voluntarily in organic distribution, the organic performance may be strong enough for paid testing too.
Build ad sets from what the audience already showed you
Instagram Insights can inform paid strategy in a few direct ways:
- Use top locations to refine geo targeting in Meta Ads Manager
- Mirror top-performing formats such as Reels or carousels in ad creative production
- Pull language from top comments or replies to shape copy angles
- Promote posts that create website taps or profile visits, not just applause
If you work with creator content or whitelisted posts, this becomes even more valuable. A strong organic asset can become the basis for influencer-led paid creative, especially when the message already proved it can hold attention. For brands building that motion, this E-commerce Influencer Marketing Guide gives useful context on structuring influencer activity around commercial outcomes rather than surface engagement.
A simple operating model
Use a three-step decision rule:
Validate organically
Watch for intent signals, not just approval signals.
Adapt for paid
Tighten the hook, improve CTA clarity, and align landing-page continuity.
Scale what proves efficient
Let paid results decide how far the concept should go.
If your team needs the tactical side of campaign setup after identifying a winner, this guide on how to run Instagram ads is the practical next step.
The point isn’t that organic metrics predict paid results perfectly. They don’t.
The point is that they let you enter paid with evidence instead of instinct alone.
From Data Points to Strategic Decisions
Instagram Insights becomes useful when you stop reading it as history and start using it as direction.
Reach tells you whether the message expanded beyond your base. Engagement tells you whether people cared enough to react. Profile actions and taps hint at intent. Audience data tells you who is leaning in. Story and Reel metrics show whether attention held long enough to matter.
Put together, those aren’t isolated numbers. They’re a decision system.
That’s the true instagram insight meaning for a growth marketer. You’re not collecting analytics for reporting slides. You’re building a tighter loop between content, audience learning, and campaign execution.
A simple rhythm works best:
- Review individual content signals regularly
- Look for repeated patterns, not one-off spikes
- Promote concepts that show both attention and action
- Adjust timing based on follower behavior
If you’re refining publishing cadence, this resource on the best time to post on Instagram is a useful complement to what your own account data already shows.
Teams that grow efficiently don’t just publish more. They learn faster from what the platform is already telling them.
If you want to turn those Instagram signals into faster Meta campaign execution, AdStellar AI helps teams launch, test, and scale ad variations without the usual manual grind. It’s built for marketers who want to move from insight to action faster, using performance data to rank winners and push better campaigns live with less guesswork.