So, what exactly are marketing campaign analytics?
It’s the discipline of measuring, managing, and making sense of your marketing performance.Think of it as translating all that raw data from your campaigns into clear, actionable insights that tell you what’s working, what isn't, and why. This is how you move past guesswork and start making data-driven decisions that actually fuel growth.
Why Marketing Campaign Analytics Is Your Growth Compass

Staring at a Meta Ads dashboard packed with metrics can feel like trying to fly a plane through a storm without any instruments. You see impressions, clicks, and spend, but the critical information—your altitude, direction, and how much fuel is left—is completely lost in the noise. This is exactly where marketing campaign analytics comes in, acting as your strategic compass to cut through the turbulence.
Success in performance marketing isn't about collecting mountains of data; it's about turning that data into decisive action. Your analytics are the instrument panel in your cockpit. Each metric tells you something vital, helping you answer the core questions that decide whether you hit your destination or run out of fuel mid-flight.
Guiding Your Strategic Decisions
When done right, analytics lets you navigate the messy marketing landscape with confidence. Your strategy shifts from making reactive tweaks to proactive, informed choices that directly fatten your bottom line.
Here’s how it acts as your guide:
- Identifies Top Performers: Pinpoint the exact ads, audiences, and channels driving your most valuable results, so you know where to double down.
- Reveals Underperforming Areas: Quickly spot the campaigns that are just burning cash without delivering a positive return, letting you cut losses and reallocate that spend.
- Answers the "Why": Move beyond knowing what happened to understanding why it happened. This is where you find the insights to replicate success and sidestep future failures.
- Creates a Clear Flight Path: Build a scalable growth plan based on what’s proven to work, not just what you think will work. Every dollar gets a job, and that job is to hit your business goals.
Navigating the Data Overload
Let's be honest, the problem today isn't a lack of data. It's having way too much of it. The sheer volume can be paralyzing, making it almost impossible to find the signal in the noise. In fact, marketing teams are now wading through 230% more data than they were in 2020. Despite this, a staggering 56% of marketers admit they don't have enough time to properly analyze it all, which puts a massive brake on growth. You can dig deeper into these numbers in the 2025 Marketing Data Report.
The whole point of marketing campaign analytics is to turn this data chaos into a clear, actionable flight path. It's about having the right instruments to tell you precisely what adjustments to make to stay on course and accelerate toward your targets.
This guide will show you how to build that instrument panel. We'll walk through the metrics that actually matter, the setup you need for accurate readings, and how to transform your analysis into a powerful engine for scaling your business. We'll also explore how modern AI tools like AdStellar are changing the game, acting as an intelligent co-pilot to speed up your analysis and decision-making.
Understanding The Metrics That Actually Matter

To really get a grip on your campaign analytics, you have to look past the buzzwords. Think of each metric as a piece of a larger story—and learning to read how they connect is what separates the pros from the amateurs. It’s easy to get lost in a sea of data, so let’s cut through the noise and focus on the handful of metrics that tie your ad spend directly to business growth.
These aren't just numbers on a dashboard; they're the vital signs of your marketing health. They tell you where your money is working hardest, how efficiently you’re bringing in new customers, and whether those customers are actually sticking around. Mastering the right digital marketing performance metrics is non-negotiable if you want to dial in your ROI and figure out what’s truly moving the needle.
Let's break down the essential metrics you should be watching like a hawk. The following table explains what each one measures and, more importantly, why it should matter to you as a performance marketer.
Essential Marketing Campaign Metrics Explained
| Metric | What It Measures | Why It's Important |
|---|---|---|
| ROAS | The total revenue generated for every dollar spent on advertising. | It’s your bottom-line profitability score. A high ROAS means your campaigns are making money. |
| CPA | The average cost to acquire one new paying customer from a campaign. | This is your efficiency gauge. It tells you if you're acquiring customers at a sustainable cost. |
| CTR | The percentage of people who see your ad and actually click on it. | It’s a direct measure of your ad's creative and messaging resonance. Is your ad compelling? |
| Conversion Rate | The percentage of ad clickers who complete a desired action on your site. | This shows how well your landing page delivers on the ad's promise. A low rate signals a disconnect. |
| LTV | The total projected revenue a single customer will generate over their lifetime. | It’s your long-term growth indicator. It tells you if you're acquiring valuable, loyal customers. |
By keeping these five metrics in clear view, you can get a surprisingly complete picture of your campaign's performance, from initial ad impression all the way to long-term customer value.
Gauging Profitability And Efficiency
The first place you should always look is the immediate financial health of your campaigns. Are you spending smart, and is that spend coming back to you? Two metrics give you this answer loud and clear.
Return on Ad Spend (ROAS): This is the ultimate gut check. For every single dollar you push into ads, how many dollars in revenue pop out the other side? A ROAS of 3:1 is marketer-speak for generating $3 in revenue for every $1 spent. It’s the cleanest, most direct measure of whether a campaign is a financial winner or a dud.
Cost Per Acquisition (CPA): This metric is all about efficiency. How much are you paying, on average, to land a new paying customer from a specific ad or campaign? A low CPA is great, but it’s meaningless without context.
For instance, a $100 CPA might sound terrifyingly high. But if those customers typically spend $500 with you, that’s a home run. On the flip side, a $10 CPA feels like a bargain, but it’s a fast track to going broke if those customers only ever spend $5. Understanding this balance is the core of smart campaign analysis.
Measuring Engagement And Interest
Profitability metrics tell you the final score, but engagement metrics show you the play-by-play. They reveal the "why" behind your results by measuring how well your ads capture attention and convince people to take that first step.
Think of it this way: a high ROAS is the destination, but metrics like CTR and Conversion Rate are the critical turns and green lights you need to get there. Ignoring them means you're driving blind.
Click-Through Rate (CTR): This is simple but powerful: what percentage of people who saw your ad cared enough to click it? A strong CTR tells you that your creative, copy, and targeting are hitting the mark and making your audience curious for more.
Conversion Rate: Of all the people who clicked your ad and landed on your page, how many actually did the thing you wanted them to do (buy something, sign up, etc.)? This metric is a dead giveaway for how well your landing page experience aligns with the promise you made in your ad.
Focusing On Long-Term Sustainable Growth
Short-term wins pay the bills, but sustainable growth is built on acquiring customers who deliver value for years, not just days. This is where you need to shift your focus from immediate transactions to long-term relationships.
Customer Lifetime Value (LTV) is the total amount of money you can reasonably expect to make from a single customer over their entire time with your brand. Think of it as planting an orchard instead of a vegetable patch. CPA tells you the cost of planting one seed, but LTV predicts the total harvest that single seed will yield over many seasons.
When your LTV is significantly higher than your CPA, you don't just have a good campaign—you have a sustainable, scalable business model.
By mastering these core metrics, you can build a truly complete picture of your campaign performance. To go even deeper, check out our guide on other essential performance marketing metrics to round out your analyst toolkit.
Building a Rock-Solid Data Foundation
The old saying "garbage in, garbage out" is the absolute truth in marketing analytics. If your data collection is messy, incomplete, or just plain wrong, any "insights" you pull will be flawed. This leads to wasted ad spend, missed opportunities, and a whole lot of frustration.
Building a solid data foundation isn't just a technical chore to hand off to a developer. It's the single most critical step in making sure your analytics actually work for you. Think of your analytics platform as a high-performance engine—it's useless without clean fuel. A proper tracking setup is what provides that clean, high-octane fuel, ensuring every decision you make is powered by accurate, trustworthy information.
Tracing the Customer Journey with UTM Parameters
How do you really know if that big sale came from your latest email newsletter, a specific Meta ad, or that guest post you wrote last month? The answer: UTM parameters. These are simple snippets of text added to the end of a URL that act like digital breadcrumbs, telling you exactly where your traffic is coming from.
When someone clicks a link tagged with UTMs, that information gets passed straight to your analytics tools. Suddenly, you have a crystal-clear view of which channels are pulling their weight. It’s a simple practice, but it's absolutely fundamental to good marketing analytics.
Here are the core components you need to know:
- utm_source: Identifies the platform that sent the traffic (e.g.,
meta,google,newsletter). - utm_medium: Specifies the marketing medium (e.g.,
cpc,email,social). - utm_campaign: Names the specific campaign you are running (e.g.,
summer-sale-2024). - utm_content: Differentiates ads or links pointing to the same URL (e.g.,
video-ad-1,blue-button).
Using UTMs consistently turns a vague statement like "social media drove sales" into a precise, actionable insight: "Our summer-sale-2024 campaign on Meta using video-ad-1 generated $5,000 in revenue." Now that's data you can actually use.
Using Tracking Pixels as Digital Scouts
While UTMs tell you where users came from, tracking pixels tell you what they do once they arrive. A pixel is just a tiny piece of code you place on your website, and it acts like a digital scout, observing user actions and reporting them back to the ad platform.
The Meta Pixel, for example, can track valuable events like a product being added to a cart, a lead form submission, or a completed purchase. This data is pure gold for both optimization and reporting.
This event data gives ad platforms the feedback they need to understand which users are most likely to convert, so they can go out and find more people just like them. For you, it provides the ground-truth data needed to calculate essential metrics like CPA and ROAS accurately.
The Rise of Server-Side Tracking
In a world increasingly focused on user privacy, traditional browser-based tracking is becoming less reliable. Ad blockers and browser restrictions like Apple's ITP are making it harder to get a complete picture. This is where server-side tracking comes into play.
Instead of sending data from the user's browser directly to platforms like Meta, data is first sent to your own server. That server then securely passes it on. This method offers a more accurate and durable way to collect data, bypassing many of the issues that plague client-side pixels.
For marketers, this means preserving data integrity and maintaining a clear view of campaign performance, even as the rules of the game change. As the industry grapples with the decline of third-party cookies, understanding these foundational tracking mechanisms is more important than ever. You can learn more by exploring our detailed guide on the future of third-party data in marketing.
Connecting the Dots with Attribution Modeling
So, you've got clean, reliable data flowing in. Awesome. But now comes the million-dollar question: which marketing touchpoint actually gets the credit for a conversion?
Think about it. A customer’s path to purchase is rarely a straight line. They might see your ad on Meta, click a Google Search ad a week later, and finally buy after getting a promo email. Who’s the hero here? This is the exact puzzle that attribution modeling is designed to solve.
I like to think of it like a soccer team scoring a goal. Does all the credit go to the striker who kicked the ball into the net? What about the midfielder who made the perfect pass, or the defender who started the whole play from your side of the field? Each one played a part, and attribution models are just different ways of assigning credit to each player on your marketing "team."
The image below shows how a solid data foundation—built with UTMs, pixels, and server-side tracking—is the bedrock for any kind of meaningful attribution.
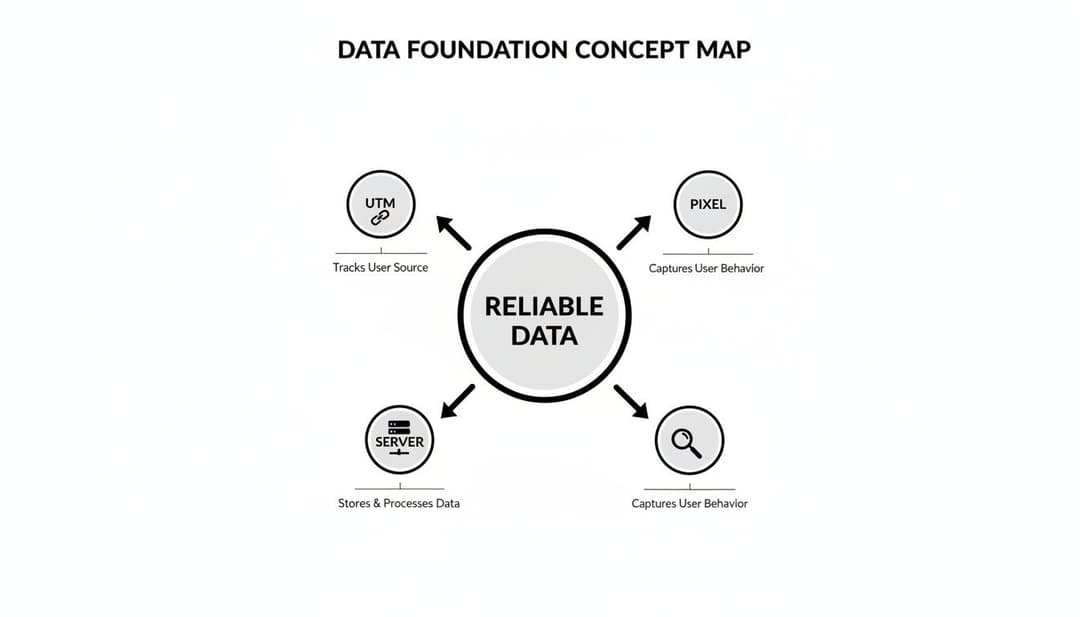
Without this plumbing in place, trying to figure out attribution is nothing more than a guessing game. You need clean data before you can start assigning credit where it's due.
Common Attribution Models and What They Tell You
Picking an attribution model is like choosing a different lens to look at your customer journey. Each one tells a slightly different story about which channels are pulling their weight. Getting familiar with these different narratives is the key to making smarter budget decisions.
Here are the most common models you'll run into:
- Last-Touch Attribution: This is the simplest model and the default for many platforms. It gives 100% of the credit to the very last thing a customer clicked before converting. It’s like only giving credit to the goal scorer.
- First-Touch Attribution: The complete opposite. This model gives 100% of the credit to the very first touchpoint a customer had with your brand. Think of it as crediting the defender who first kicked the ball upfield.
- Linear Attribution: This model is the diplomat. It spreads the credit evenly across every single touchpoint. If there were four interactions, each one gets 25% of the credit.
- Data-Driven Attribution: This is the most sophisticated approach. It uses machine learning to crunch the numbers on both converting and non-converting paths to figure out how much credit each touchpoint really deserves.
Choosing the Right Model for Your Business
So, which model is the "best" one? The honest answer is: it depends entirely on your business goals. There's no single right answer, but some models are definitely a better fit for certain objectives.
A classic mistake is just sticking with Last-Touch attribution because it's the default. While it's easy to understand, it almost always overvalues your bottom-of-funnel channels (like branded search) and completely ignores the top-of-funnel channels (like social media ads) that introduced new people to your brand in the first place.
If your main goal is bringing new customers into your world, a First-Touch model can be incredibly revealing. It shines a light on the channels that are best at discovery and awareness.
On the other hand, if you have a super short sales cycle where people decide and buy in a flash, Last-Touch might actually work just fine. For longer, more considered purchases, a Linear or Data-Driven model gives you a much more balanced and accurate picture of what's truly driving decisions. It's also critical to consider how other conversion types, like view-through conversions, play into your overall strategy. You can dive deeper into that topic by reading our guide on what is view-through conversion.
By experimenting with a few different models, you’ll start to see a much richer story emerge from your data. You'll understand which channels are great for opening conversations versus which ones are built to close the deal, allowing you to invest your budget with a whole new level of confidence.
Turning Raw Data into Actionable Insights
Having clean, well-attributed data is a huge win, but it’s really just the price of entry. A spreadsheet full of raw numbers doesn't tell you what to do next. The real magic happens when you turn that data into a story—one that guides your decisions and actually fuels growth.
This is where a well-designed marketing dashboard becomes your best friend. It’s not a data dump; it's a visual narrative of your campaign’s performance. A great dashboard cuts through the noise and puts your most important metrics front and center, letting you shift from just looking at numbers to actively questioning them.
Building Your Campaign Command Center
An effective dashboard isn’t about cramming every metric onto one screen. It's about ruthless prioritization. It should give you a bird's-eye view of your main goals at a glance, while also letting you drill down into the "why" behind those numbers.
Start by focusing on the core metrics tied directly to your business goals:
- Primary Metrics: Put your non-negotiable KPIs, like ROAS and CPA, right at the top. These are the numbers that tell you if you’re making money or losing it.
- Secondary Metrics: Below those, add the diagnostic metrics that influence your top-line goals, like CTR, Conversion Rate, and Cost Per Click (CPC).
- Breakdowns: This is crucial. Add filters that let you slice your data by campaign, ad set, audience, creative, and placement. This is how you pinpoint exactly what's working and what's not.
This layered approach means you can spot a problem instantly (e.g., "ROAS tanked yesterday") and immediately start digging for the cause ("Ah, the CTR on our best video ad just fell off a cliff"). For a deeper dive into the numbers that matter, check out our guide on how to calculate marketing ROI.
A Practical Workflow for Analysis
With your command center up and running, you can now build a repeatable workflow for turning those campaign analytics into smart optimizations. Instead of getting lost in a sea of data, your analysis becomes a focused, three-step process for uncovering hidden opportunities.
- Identify Trends and Outliers: Scan your dashboards for anything that jumps out. Look for sudden performance dips that might signal ad fatigue, or sharp spikes that point to a winning creative-audience combo you need to double down on.
- Form a Hypothesis: When you spot a trend, ask "why?" For instance, if a new ad has a great CTR but a terrible conversion rate, your hypothesis might be: "The ad is grabbing attention, but the landing page isn't delivering on the promise."
- Test and Validate: Now, design a specific A/B test based on your hypothesis. Using the example above, you could test a new landing page headline that perfectly matches the ad copy. This transforms analysis from a boring reporting task into a powerful engine for constant improvement.
This structured approach empowers you to make confident, data-backed decisions. You stop guessing what might work and start systematically testing your way to better results, turning insights directly into action.
How AI Is Revolutionizing Campaign Analytics

Trying to analyze modern marketing campaigns by hand is like using a paper map in the age of GPS. It gets the job done, eventually, but it’s slow, full of potential wrong turns, and can’t possibly keep up with the sheer volume of data we have today.
The future of campaign analytics isn't just about fancier dashboards. It's about having an intelligent co-pilot that turns days of tedious work into minutes. This is where AI comes in, not to replace marketers, but to give them superpowers. AI platforms are built to chew through millions of data points, spot patterns a human would never see, and free you up to focus on strategy, not spreadsheets.
From Reactive Adjustments To Proactive Automation
The old way of doing things is completely reactive. You launch a campaign, wait for the data to trickle in, spend hours digging through reports, and then make a change. By that point, you’ve already burned through a good chunk of your budget.
AI flips this entire model on its head. It allows you to be proactive.
Instead of just telling you what happened yesterday, AI can predict what’s likely to happen tomorrow. It analyzes early performance signals to forecast where a campaign is headed, flagging the duds before they waste serious cash. This gives you the power to jump in early, shift spend to the winners, and stop costly mistakes in their tracks.
AI doesn't just show you the data; it helps you see the future. It transforms marketing campaign analytics from a historical report into a forward-looking guidance system that actively helps you scale.
This shift is a big deal. Global AI-enabled media spending is projected to hit $370 billion, and the AI in marketing market is expected to reach $36 billion by 2025. Yet, 84% of CMOs admit they still struggle with executing their strategy, which shows just how badly we need tools that connect data to decisive action.
Pinpointing Your Most Profitable Segments
One of the most powerful things AI does is find your absolute best audience and creative combinations with surgical precision. A platform like AdStellar, for instance, goes way beyond telling you which ad got the best ROAS. It cross-references performance data across hundreds of variations to answer much deeper questions.
- Audience Insights: AI might uncover that women aged 25-34 in California consistently deliver a 30% higher LTV when you show them ads with user-generated content. Good luck finding that in a pivot table.
- Creative Intelligence: It can spot that ads with a specific headline formula or color palette drive a 20% higher CTR, no matter who sees them.
- Message Resonance: By analyzing ad copy, AI can identify the exact words and phrases that lead to the most conversions, helping you nail your messaging every time.
This kind of granular analysis takes you from basic A/B testing to a world of multi-variant optimization. The insights are sharper, and the actions you take are far more impactful.
Automating Budget and Campaign Optimization
The whole point of analytics is to make better decisions, faster. AI takes this one step further by actually automating the decisions themselves. An AI-powered tool can watch your campaigns in real-time and automatically move the budget around based on rules you set.
Imagine this workflow:
- AI Identifies a Winner: The system flags an ad set that's crushing it with a ROAS of 4.5:1, way above the campaign average.
- Budget is Reallocated: It automatically pulls the plug on underperforming ads and funnels that budget over to the high-performer.
- Scaling is Triggered: As the winning ad set keeps performing with the extra budget, the AI might even suggest cloning it to test on new, similar audiences to scale even further.
This automated loop of analysis and action means your campaigns are being optimized 24/7, not just when you have time to check a report. Platforms that leverage AI and Advanced Analytics are making this a reality.
By handing off these repetitive tasks, marketers get to reclaim their time and focus on big-picture strategy and creative thinking. To see how agencies are putting these systems to work, check out our guide on the top AI tools for marketing agencies.
Your Marketing Campaign Analytics Questions Answered
Even with the best tools and a solid game plan, you're always going to run into questions when you get down to the nitty-gritty of campaign analytics. This section tackles the most common things marketers ask, giving you straight answers to help you navigate the daily challenges of growing with data.
How Often Should I Check My Campaign Analytics?
There’s no magic number here—the right rhythm for checking your analytics really depends on what you're running and what you're trying to achieve. The goal is to stay informed without getting sucked into a data vortex.
For active paid campaigns, daily check-ins are non-negotiable. A quick, five-minute look at your core numbers like ROAS, CPA, and total spend is all it takes. This lets you spot problems before they burn through your budget or, just as importantly, double down on a winning ad while it has momentum.
Beyond that, set aside time for a deeper weekly analysis. This is when you can zoom out a bit, look for trends, see how your A/B tests are shaking out, and make smarter calls on where to move your budget. And for the big picture, use monthly and quarterly reviews to see how you’re tracking against your larger business goals.
What Is The Biggest Mistake Marketers Make With Analytics?
The single most common trap is analysis paralysis. It's that feeling of drowning in a sea of data but never actually doing anything with it. Too many marketers get bogged down tracking dozens of metrics—many of which are just vanity numbers like impressions or clicks that don't tie back to the bottom line.
The point of campaign analytics isn’t just to report on what happened. It’s to make faster, smarter decisions about what to do next.
To sidestep this, get ruthless about your focus. Zero in on the handful of metrics that actually impact revenue, like ROAS, CPA, Conversion Rate, and LTV. Before you even open a dashboard, ask yourself: "What question am I trying to answer?" This simple shift turns analytics from a passive reporting chore into an active tool for testing, learning, and winning.
How Can I Use Analytics With A Very Small Budget?
Analytics isn't a luxury reserved for massive teams; it's arguably more important when every single dollar has to pull its weight. When you have a small budget, you simply can't afford to guess. The good news is, you don’t need a massive software stack to get powerful insights.
Here’s how to get started:
- Nail the fundamentals: The first thing you should do is install your Meta Pixel and set up Google Analytics 4. They're free, and they give you a treasure trove of data on who's visiting your site and what they're doing.
- Tag everything with UTMs: Use UTM parameters on every single link you share—whether it’s in an ad, a social post, or an email. This is how you find out exactly where your traffic and conversions are coming from, so you know what’s working.
- Focus on one or two key metrics: Don't try to boil the ocean. Pick the metric that matters most for your business—maybe that’s Cost Per Lead (CPL) if you're a service business or ROAS if you run an e-commerce store—and obsess over that.
These steps are enough to give you a clear picture of what's working, so you can invest your limited budget with confidence and make every dollar stretch further.
Ready to stop guessing and start scaling? AdStellar AI automates your campaign analysis, identifying your top-performing ads, audiences, and creatives in real-time. Turn insights into action 10x faster by visiting https://www.adstellar.ai.