To figure out if your ads are actually working, you need a rock-solid data foundation. It’s not just about tracking clicks. It's about connecting those clicks to real business goals like ROAS and CPA and proving the true value your campaigns deliver. Without this, you’re just guessing.
Building Your Measurement Foundation
Before you can analyze a single metric, you have to get your data house in order. If the data you’re collecting is messy or incomplete, any insights you pull will be flawed, leading straight to wasted ad spend. Building this framework isn't just a technical box to check—it’s the single most important step you can take.
To really get this right, you have to understand the bigger picture of how to measure marketing effectiveness. It all starts with a few interconnected layers of tracking that paint a full picture of the customer journey.
Mastering UTM Parameters for Granular Insights
Think of Urchin Tracking Modules (UTMs) as digital breadcrumbs. They're simple tags you add to your ad URLs that tell your analytics software exactly where each visitor came from. Without them, all your paid traffic from Meta might just get lumped together as "facebook.com," leaving you blind to which specific campaign, ad set, or creative actually drove a sale.
A consistent UTM structure is non-negotiable. For example, an e-commerce store running a summer sale on Meta could use something like this:
utm_source=meta
utm_medium=cpc
utm_campaign=summer-sale-2024
utm_content=video-ad-testimonial
This level of detail lets you see with total clarity that your "video-ad-testimonial" in the "summer-sale-2024" campaign generated $5,000 in revenue. This is how you spot your winners and cut your losers.
Deploying Client-Side and Server-Side Tracking
Next up are the tracking pixels and APIs—the engines that collect data on what people do once they land on your site. The Meta Pixel is a snippet of code you place on your website to track actions like page views, add-to-cart events, and purchases. It's absolutely essential for optimizing campaigns and running retargeting.
If you're just getting started, we have a great guide on how to find and use your Meta Pixel ID.
But here’s the catch: browser privacy updates and ad blockers can stop the pixel from firing, leading to some serious data gaps. That's where server-side tagging comes in.
Key Takeaway: Relying solely on browser-based pixels is a recipe for disaster in 2024. Server-side tracking sends data directly from your server to platforms like Meta, bypassing browser issues and giving you a much more accurate and complete dataset.
This infographic breaks down how these core tracking elements—UTMs, Pixels, and Server-Side Tagging—all fit together.
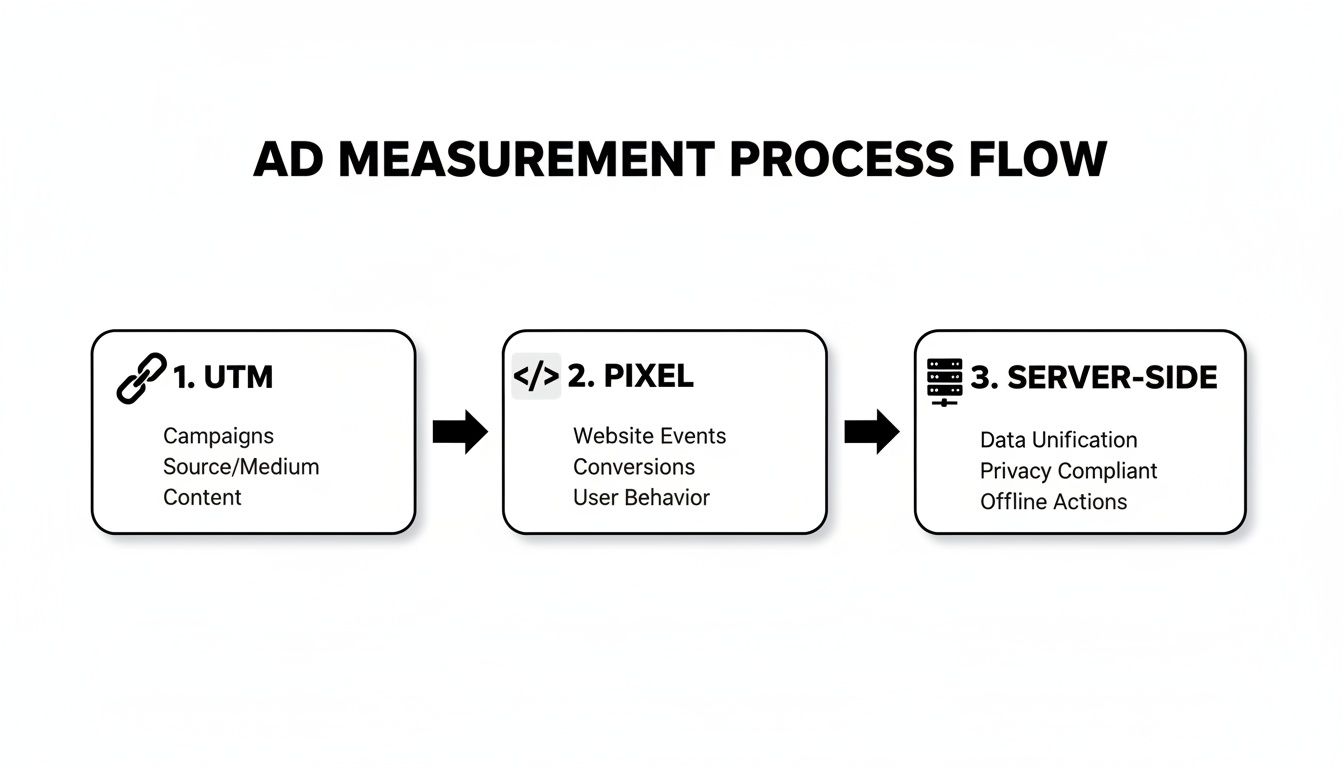
As you can see, it's a clear progression. You start with link-level tracking (UTMs), move to on-site browser tracking (Pixel), and reinforce it all with a robust server-to-server connection for data integrity.
For a B2B SaaS company, this dual-tracking approach means you can accurately follow a user who clicks a Meta ad, checks out the pricing page (captured by the Pixel), and then signs up for a demo a day later (captured reliably by the Conversions API). You don't lose sight of that valuable conversion just because of a browser setting.
Without this complete foundation, any attempt to measure your ad effectiveness is basically built on quicksand.
Choosing KPIs That Actually Matter
When you first launch a campaign, it’s easy to get lost in a sea of data. Big numbers for impressions and high click-through rates (CTR) can feel like a win, but they don't tell the whole story. These are what we call vanity metrics—they look good on a report but have a weak connection to what really matters: your bottom line.
Think of it this way: a high CTR is great. It means your ad was compelling enough to grab someone's attention and earn a click. But that's just the first step. If all those clicks don't lead to sales, sign-ups, or qualified leads, you're essentially just paying for website visitors, not business growth. The real story unfolds after the click.
Distinguishing Vanity Metrics from Business Drivers
The first thing you need to do is separate the feel-good numbers from the ones that actually drive your business forward. This distinction is what separates amateur advertisers from professional performance marketers.
Top-of-Funnel Indicators (Vanity Metrics): This is your surface-level data, like impressions, reach, and CTR. They're useful for quick diagnostics—a rock-bottom CTR, for instance, probably means your creative or copy isn't hitting the mark. But they should never be your main measure of success.
Bottom-of-Funnel Drivers (Business KPIs): These are the numbers that directly tie into revenue and growth. They answer the only question that truly matters: "Is this ad campaign making us money?"
The shift in focus from "how many people saw it?" to "what action did they take?" is the single most important mindset change for any performance marketer. It's the difference between spending money and investing it.
Core KPIs for E-commerce and Lead Generation
Your most important KPIs will depend on your specific business model, but a handful of metrics are foundational for almost any advertising dashboard.
Cost Per Acquisition (CPA): This is your all-in cost to land one new customer or lead. You get this number by dividing your total ad spend by your total number of conversions. A lower CPA is almost always a sign of a more efficient campaign.
Return on Ad Spend (ROAS): This metric tells you the gross revenue you're bringing in for every single dollar you spend on ads. A 4:1 ROAS, for example, means you're making $4 for every $1 spent. Getting a handle on your ROAS is non-negotiable, and you can dive deeper in our detailed guide to Return on Ad Spend.
Customer Lifetime Value (LTV): This is a predictive metric that estimates the total revenue you can expect from a single customer over their entire relationship with your brand. The real magic happens when you compare LTV to CPA. If it costs you $50 to acquire a customer (CPA) who will eventually spend $500 with you (LTV), you've built a highly profitable growth engine.
With digital advertising projected to account for 82.2% of all ad spending by 2030, tracking these metrics is more critical than ever. But here’s the reality check: despite the massive investment, only 31% of US consumers say they buy something from an online ad every few months. This gap between spending and converting shows just how much money is wasted without precise measurement. You can explore more of these trends in this digital advertising statistics report.

Aligning KPIs with Your Campaign Goals
Your KPIs should always be a direct reflection of your campaign's objective. A generic, one-size-fits-all dashboard just won’t cut it. You need to tailor your metrics to the job at hand.
Here's a breakdown of how different campaign goals demand different KPIs.
Key Performance Indicators (KPIs) by Campaign Objective
A comparison of essential KPIs tailored to different advertising goals, helping marketers select the right metrics to measure success accurately.
| Campaign Objective | Primary KPIs | Secondary/Diagnostic Metrics |
|---|---|---|
| E-commerce Sales | ROAS, CPA, Conversion Rate | Add to Cart Rate, CTR, Cost Per Click (CPC) |
| B2B Lead Generation | Cost Per Lead (CPL), Lead-to-Customer Rate | Landing Page Conversion Rate, Cost Per MQL |
| Brand Awareness | Reach, Ad Recall Lift, Video View Rate | Impressions, Frequency, CPM (Cost Per Mille) |
This table shows why context is everything.
For an e-commerce brand running ads on a platform like Meta, the goal is almost always turning a profit on sales. Your dashboard needs to have ROAS and CPA front and center. If those numbers look good, it’s a green light to scale your budget. If they start to drop, you can then dig into your secondary metrics like CTR or Add to Cart Rate to figure out what's broken. Is the ad failing to connect, or is something pushing people away on the product page?
On the other hand, a SaaS company running a campaign to get free demo sign-ups will live and die by its Cost Per Lead (CPL). The main goal here is to fill the sales pipeline with qualified prospects at a cost that makes sense for the business.
By focusing on the right KPIs for the job, you can stop guessing and start measuring your advertising effectiveness with clarity and purpose.
Mastering Attribution and Proving Incrementality
So, your campaign is getting conversions. That's great, but the real question is, why? Which ad actually sealed the deal? Was it the first video they saw last week, the carousel ad they clicked yesterday, or the final retargeting ad that pushed them over the edge?
This is the core challenge of attribution. It's the framework you use to give credit to the different touchpoints a customer interacts with on their way to making a purchase. If you get this wrong, you risk cutting your best top-of-funnel campaigns or pouring money into bottom-funnel ads that just hoover up credit for sales you were going to get anyway.
Getting Credit Where Credit Is Due: Choosing an Attribution Model
There’s no single “best” model for every business. The right one for you hinges on your sales cycle and product. A simple, low-cost item might not need a complex model, but a high-ticket purchase with a long consideration phase definitely does.
Here are the most common models you'll encounter:
- Last-Touch Attribution: The default on many platforms. It gives 100% of the credit to the final touchpoint before a conversion. It’s simple, but it’s also a bit like giving all the credit to the cashier for a sale, ignoring the window display and the helpful salesperson who guided the customer.
- First-Touch Attribution: This is the polar opposite, giving all the credit to the very first ad someone saw. It’s fantastic for spotting which campaigns are bringing new people into your world, but it completely misses what happens next.
- Data-Driven Attribution (DDA): Offered by platforms like Google and Meta, this is the most sophisticated option. It uses machine learning to analyze countless converting and non-converting paths to figure out how much credit each touchpoint truly deserves. If you have enough data, this is almost always the way to go.
If you want to go deeper into how Meta specifically handles this, our complete Meta ads attribution and tracking guide is a great next step. Getting a handle on these models is the first piece of the puzzle.
Moving Beyond Correlation with Incrementality Testing
Attribution tells you which ad gets the credit, but it can’t answer a much more important question: “Would this sale have happened anyway?”
That’s where incrementality comes in. It measures the true causal lift from your ads—the sales that simply would not have happened without them.
Key Insight: Incrementality testing is the gold standard for proving your ad spend works. It shifts the conversation from correlation (people who saw ads also bought) to causation (people bought because they saw the ads). This is how you prove to your CFO that your ad budget is a growth-driving investment, not just an expense line.
The most straightforward way to measure this is with a holdout test. It’s simpler than it sounds.
How to Run a Simple Holdout Test on Meta
A holdout test is where you intentionally hide your ads from a small, random slice of your target audience. Then, you compare their buying behavior to the group that did see the ads. The difference between the two is your true incremental lift.
Here’s a quick way to set this up for a Meta campaign:
- Define Your Audiences: Start by creating two identical audiences. A simple way is to upload your entire email list twice, creating "Audience A" and "Audience B."
- Create the Holdout Group: When you set up your campaign, tell Meta to target "Audience A" but specifically exclude "Audience B." Now, Audience B is your holdout group—they match your target profile but will never see your ads.
- Run the Campaign and Measure: Let the campaign run long enough to get statistically significant results (this could be a few weeks, depending on your traffic and sales volume). At the end, compare the conversion rate from Audience A (who saw the ads) to the organic conversion rate from Audience B (who saw nothing).
Let's say Audience A had a 5% conversion rate and Audience B had a 2% organic conversion rate. Your incremental lift is 3%. This is the real, undeniable impact your ads had. This is the kind of data that justifies budgets and lets you scale with confidence.
If your KPIs tell you what happened, a solid experiment will tell you why. This is the critical difference between just running ads and actually building a predictable growth engine. The best in the game aren't just guessing; they're constantly testing, learning, and refining their approach to figure out what truly moves the needle.
It's how you uncover the insights that slash acquisition costs and consistently improve your results.

This process is about more than just swapping out one headline for another. To get real answers, you need a disciplined framework for testing everything—creatives, audiences, placements, you name it. It's about building a culture of experimentation that generates clear, actionable insights, not just more data.
Going Beyond Basic A/B Tests
A simple A/B test is a fantastic starting point, but it's slow. Testing one variable at a time just doesn't cut it when you need answers fast. What happens when you want to test three different images, two headlines, and two calls to action all at once? That's when you graduate to multivariate testing.
This method doesn't just tell you which individual element won. It reveals which combination of elements works best together.
For example, an e-commerce brand might discover that a "Shop Now" CTA crushes it when paired with a lifestyle image, but a "Learn More" CTA is the winner with a product-focused shot. A standard A/B test would never uncover that kind of interaction. If you're ready to get more sophisticated, our guide on how to test ads effectively breaks down the framework.
Avoiding the Most Common Experiment Pitfalls
Honestly, a poorly designed test is worse than no test at all. It gives you false confidence and sends you chasing flawed results. It’s a huge waste of time and budget.
Keep an eye out for these classic mistakes that will sink your experiments:
- Changing too much at once. If you swap the headline, image, and CTA in an A/B test, you have no clue what actually caused the performance shift. Stick to one change.
- Calling it too early. Ending a test after a day or two is a recipe for making decisions based on random noise. You need to let it run long enough to reach statistical significance.
- Ignoring audience overlap. Testing two different audiences? Make sure they aren't bleeding into each other. Overlap contaminates your data and makes it impossible to know which group is truly performing better.
- Forgetting about the real world. A holiday weekend, a huge news story, or a competitor's flash sale can all throw your results for a loop. Always analyze your data with context in mind.
Expert Tip: For any A/B test, isolate one key variable. For multivariate tests, make sure your tool can handle the combinations cleanly. Your control group—the original ad—is your north star. Every new variation has to prove itself against the original.
Using Automation to Test Faster and Smarter
Let's be real: manually setting up, launching, and tracking dozens of ad variations is a nightmare. It’s slow, tedious, and a perfect recipe for human error. This is exactly where automation becomes a game-changer for measuring your ad effectiveness.
In 2024, global ad spend is projected to hit nearly $1.1 trillion, with a staggering 72.7% flowing into digital channels. With social media alone soaking up a quarter-trillion dollars, the pressure to prove every dollar's worth with hard metrics like ROAS and CPA is immense. You can dig deeper into these global advertising trends for more context.
This is the exact problem tools like AdStellar AI were designed to fix. Instead of spending hours manually creating a handful of ad variations, you can generate hundreds of creative, copy, and audience combinations in minutes. The platform then automates the entire launch, pulling in historical data to rank the top performers against your business goals.
This system turns a painfully slow manual process into a cycle of rapid, AI-powered iteration. It lets you find the winning formulas quickly and scale them confidently, giving you a serious edge in a crowded market.
Using AI and Automation for Smarter Measurement
Let's be honest: trying to measure modern ad campaigns manually is a losing battle. The amount of data we're dealing with, combined with complex customer journeys, means the old way of doing things just doesn't cut it anymore. Spreadsheets simply can't keep up.
This is where AI and automation are changing the game. They’ve moved from buzzwords to practical tools that give savvy marketers a serious edge. Imagine trying to find your single best-performing ad creative by combing through thousands of rows of data. It’s slow, tedious, and you’re bound to miss something. AI can do that in seconds, connecting performance directly to your bottom line.
Shifting from Manual Analysis to AI-Powered Insights
The real job of AI in ad measurement is to cut through the noise. Instead of you hunting for insights, the most important findings come directly to you.
Platforms like AdStellar AI plug right into your Meta Ads Manager, learning from your past performance and analyzing new results as they happen. This creates a feedback loop that gets smarter with every dollar you spend.
This isn't just about spitting back numbers. It’s about answering the questions that actually matter for growth:
- Which specific creative elements are consistently driving the highest ROAS?
- What audience segments are really clicking with your new messaging?
- Is a particular headline boosting conversion rates across all of your campaigns?
Figuring this out by hand would take hours, if not days. An AI-powered system delivers these insights automatically, freeing you up to think about strategy instead of getting lost in data manipulation. If you're looking for more ways to blend traditional methods with new tech, it's worth exploring how to measure marketing effectiveness using Excel and AI.
The scale of today's advertising world makes this shift a necessity, not a luxury. With US ad spend projected to soar past $450 billion in 2025 and mobile ads alone accounting for $228.11 billion, the stakes are huge. More importantly, when 46% of shoppers say they're more likely to buy from relevant mobile ads, proving that relevance with hard numbers is non-negotiable.
A Practical Workflow from Insight to Action
The best automation doesn't just show you the winners—it puts them to work for you. The most effective AI systems close the loop by turning insights directly into action, transforming a painful manual process into a repeatable system for growth.
Here’s what that looks like in the real world for an e-commerce brand using AdStellar AI:
- AI Insight Generation: The platform scans all active and past campaigns, instantly pinpointing the top 5% of creatives, copy, and audiences based on what’s actually driving a lower CPA and higher ROAS.
- Automated Campaign Assembly: Instead of just showing you a dashboard, the "AI Launch" feature takes these proven elements and builds entirely new campaigns. It might pair your best-performing image with your most effective headline and target the audience that has already shown the highest purchase intent.
- Launch and Continuous Learning: With just one click, you can push dozens of new, high-potential ad variations live. As the performance data comes in, the system learns and refines its recommendations for the next launch cycle.
This is how you end the creative chaos. It’s a structured way to double down on what works without all the manual grunt work.
Key Takeaway: AI-powered measurement isn't about replacing the marketer. It's about giving them superpowers—freeing them from tedious analysis so they can focus on high-level strategy, creative direction, and scaling what’s already proven to work.
Visualizing the Automated Workflow
The goal of these tools is to deliver clarity and speed. Forget about navigating dozens of tabs in Ads Manager. You get a single, unified view of your top performers.
This kind of dashboard instantly shows you which creatives are driving results, ranked by the metrics you actually care about. This clarity allows you to make faster, more confident decisions about where your budget and creative energy should go next.
Making this move toward automation is crucial for any team looking for an edge. By integrating these systems, you’re not just measuring your ads more efficiently; you’re building a smarter, data-driven engine for growth. You can dive deeper into this topic in our guide to generating AI-driven marketing insights.
Answering Your Toughest Ad Measurement Questions

Even with the best game plan, you're going to hit some tricky measurement questions. The ad world is a messy place, and clear answers aren't always handed to you on a silver platter. Let's tackle some of the most common challenges I see marketers wrestling with and get you some practical solutions you can use today.
How Do I Measure Effectiveness With All These Privacy Changes?
The post-iOS 14 world made direct, one-to-one tracking a lot tougher. But that doesn’t mean measurement is a lost cause. You just have to adapt the strategy, not throw in the towel.
Your first move should be implementing Meta’s Conversions API (CAPI). This creates a direct, server-to-server link to Meta, letting you sidestep a lot of the browser-level blockers and claw back some of that lost conversion data.
Next, it's time to get comfortable with modeled data. Platforms like Meta now use tools like Aggregated Event Measurement (AEM) to estimate conversions when a direct line of sight isn't there. It’s not perfect, but it's now a crucial piece of the puzzle.
Pro Tip: You have to shift some of your focus from tiny, user-level attribution to bigger-picture analysis. This is where things like media mix modeling (MMM) and incrementality tests (like geo-lifts) become more valuable than ever. They help you see the forest for the trees, understanding the total impact of your ad budget without needing every single cookie.
Finally, double down on building your own first-party data. Use lead magnets, email sign-ups, and on-platform offers to forge a direct relationship with your audience. That gives you a valuable, privacy-compliant dataset that you actually control.
What Is a Good ROAS for My Industry?
This is probably the most common question I hear, and my answer is always the same: it depends entirely on your profit margins. The old 4:1 ROAS ($4 in revenue for every $1 spent) is thrown around as a general benchmark, but it’s dangerously generic.
Think about it: for a high-margin software business, a 3:1 ROAS might be wildly profitable. But for a low-margin e-commerce brand selling physical goods, a 10:1 ROAS might be the bare minimum just to break even.
The only way to know your number is to calculate your break-even ROAS. The formula is dead simple:
Break-Even ROAS = 1 / Your Profit Margin
So, if your profit margin on a product is 25% (or 0.25), your break-even ROAS is 4 (1 / 0.25). Anything you get above a 4 is profit. Your goal isn't to chase some arbitrary industry number; it's to consistently beat your own break-even point.
How Often Should I Check My Ad Performance?
The right answer here depends on your budget and how long the campaign has been in the wild. The biggest mistake I see is over-checking. It leads to knee-jerk optimizations that constantly disrupt the ad platform’s learning phase and, ironically, torpedo your performance.
Here’s a good rule of thumb I use:
- New or high-spend campaigns (over $1,000/day): A daily check-in on core KPIs like CPA and ROAS makes sense. You're not looking to tweak bids every hour; you're just looking for major fires that need putting out.
- Mature, stable campaigns: Checking in every two or three days is plenty. This gives you enough data to spot actual trends instead of just reacting to normal daily ups and downs.
- Weekly and monthly reviews: This is for the big-picture stuff. Reserve this time for strategic analysis—looking at trends over time, spotting creative fatigue, and making budget allocation decisions for the weeks ahead.
My CTR Is High but Conversions Are Low. What’s Broken?
Ah, the classic. This is almost always a sign of a major disconnect between your ad and your landing page. A high click-through rate (CTR) is great! It means your ad creative and copy are doing their job—they’re grabbing attention and making a promise that people want.
The low conversion rate tells you the landing page isn't delivering on that promise. The experience after the click is failing to meet the expectations your ad just set.
Start your investigation by auditing for message match. Do the headline, the offer, and the visuals on the landing page perfectly reflect what the user saw in the ad? If there's a mismatch, you've created a jarring, confusing experience, and they'll bounce.
Next, put the page itself under a microscope.
- Is it slow to load?
- Is it a nightmare to use on a phone?
- Is the call-to-action (CTA) buried or unclear?
- Is your form asking for their life story?
A/B testing different landing page elements is the fastest way to diagnose and plug the leak in your funnel.
Ready to stop guessing and start scaling? With AdStellar AI, you can automate your ad creation, testing, and optimization. Our platform uses AI to identify your top-performing creatives and audiences, letting you launch hundreds of high-potential ad variations with a single click. Discover how performance marketers are building winning campaigns 10x faster at https://www.adstellar.ai.