Calculating your Cost Per Acquisition (CPA) all boils down to a pretty straightforward formula, but the story it tells is anything but simple. In essence, you take your total marketing and sales spend and divide it by the number of new customers you brought in during that same period.
This single number cuts right through the noise, telling you exactly what you paid to win each new customer.
Calculating Your Core Cost Per Acquisition
Forget vanity metrics like clicks and impressions for a second. Your CPA is the ultimate gut check for marketing efficiency. It answers the one question that really matters: are you spending your budget wisely to bring in actual, paying customers? Nailing this calculation is the first step toward building a profitable, scalable advertising machine.
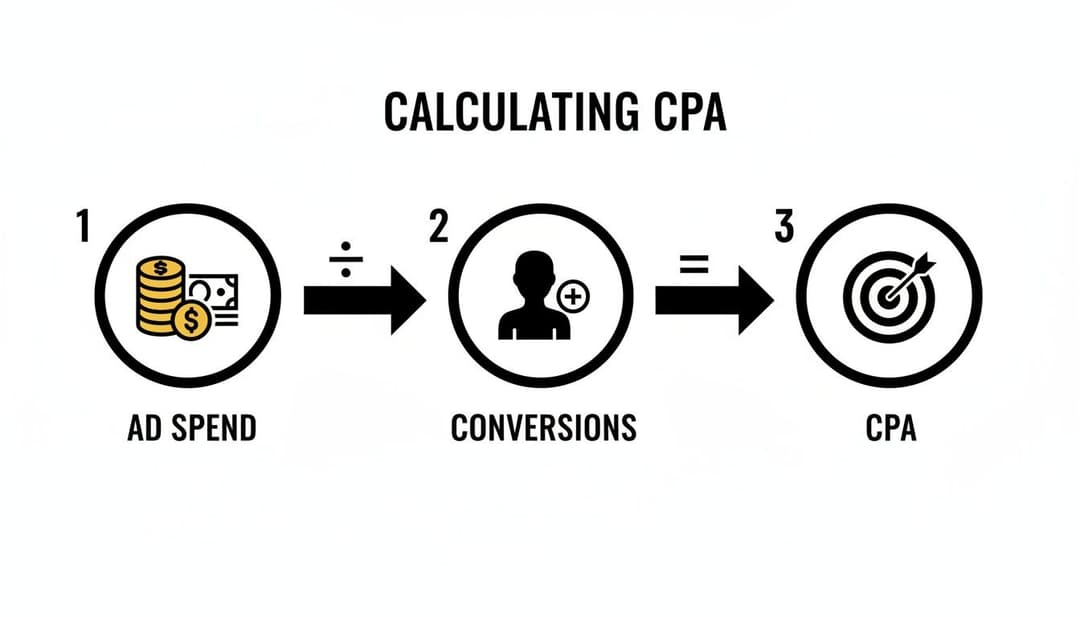
The foundational formula is your starting point:
CPA = Total Ad Spend / Total Conversions
It looks simple, and it is. The real magic, however, is in how you define those inputs. "Total Ad Spend" is rarely just the number you see in your Meta Ads Manager dashboard. To get a true picture, you have to account for all the direct expenses tied to that campaign.
Breaking Down the Formula Components
To get an accurate CPA, you've got to be honest with yourself about the full cost. This means thinking beyond just the ad click. Did you have other expenses?
- Creative Production: What about the cost of that freelancer you hired for video ads or the graphic designer who made the static images?
- Agency Fees: If you're working with a performance marketing agency, their fees are part of the acquisition cost.
- Software & Tools: Are you paying for landing page builders, analytics software, or other tools to support the campaign?
All of these costs need to be rolled into your "Total Ad Spend" for the calculation to be truly meaningful.
Let's put some quick numbers to it. To give you an idea of the core components, here's a quick reference table breaking down the inputs for a basic CPA calculation.
Core CPA Formula Components
| Component | Definition | Example (for a $5,000 Campaign) |
|---|---|---|
| Total Ad Spend | The complete cost to run the campaign, including media, creative, and fees. | $5,000 ad budget + $500 creative = $5,500 |
| Total Conversions | The number of new customers acquired directly from the campaign. | 125 new customers |
| Cost Per Acquisition | The final calculated cost to acquire a single new customer. | $5,500 / 125 = $44 CPA |
As you can see, including those extra costs gives you a more realistic CPA to work with, which is crucial for making smart decisions.
A Real-World DTC Example
Let's make this tangible. Imagine a direct-to-consumer skincare brand launching a new face serum with a Meta campaign.
Over one month, they spend $5,000 directly on ads. The campaign is a success, bringing in 125 new customers who complete a purchase.
Plugging this into the formula:
$5,000 (Ad Spend) / 125 (New Customers) = $40 per acquisition
Just like that, the brand has a hard number. They now know it costs them $40 to get a new customer through the door with this campaign. This single metric sparks the critical strategic questions that drive growth. Is a $40 CPA profitable against the product's margin? Is it sustainable when considering the customer's potential lifetime value?
While CPA is your go-to for measuring the cost of a final sale, don't forget about ROAS (Return On Ad Spend). ROAS measures the gross revenue generated for every dollar spent. It’s a good idea to understand how to calculate ROAS to get a complete financial picture alongside your CPA. For a deeper dive into the entire process, this complete guide to customer acquisition cost calculation is an excellent resource.
Finding and Trusting Your Acquisition Data
Knowing the CPA formula is one thing. Feeding it accurate, reliable data? That’s a completely different ballgame.
This is where so many marketers stumble. The numbers you need rarely live in a single, tidy dashboard. Your real mission is to nail down a source of truth you can confidently use to make budget decisions. The calculation itself is straightforward: pull your total ad spend and divide it by your total conversions.
The formula is simple, but your CPA is only as good as the numbers you plug into it. Let's break down where to find them and, more importantly, how to trust them.
Pinpointing Your Ad Spend
Your first stop for cost data is almost always the ad platform itself. In Meta Ads Manager, finding your total "Amount Spent" for a specific timeframe is easy enough. This number is your baseline media cost—the "Total Ad Spend" part of the equation.
But hold on. As we touched on earlier, this number rarely tells the full story. It completely ignores creative development costs, agency fees, or any third-party tools you’re using to run the campaigns. For a true, all-in CPA, you have to factor in those additional expenses.
The Conversion Conundrum: Why Platforms Disagree
Now for the tricky part: conversions. When you start comparing numbers, you'll almost certainly see a discrepancy between what Meta Ads Manager reports and what a tool like Google Analytics 4 (GA4) shows you.
For example, Meta might claim 100 purchases, while GA4 only attributes 75 of those to the same campaign. What gives? It all comes down to their different attribution models.
- Meta Ads: Uses a more holistic, data-driven attribution model. It often includes view-through conversions (people who saw an ad but didn't click) and defaults to a 7-day click, 1-day view window.
- Google Analytics 4: Typically defaults to a last non-direct click model, giving 100% of the credit to the final channel a user clicked before converting.
Neither platform is necessarily "wrong"—they just measure success through different lenses. Meta's approach tries to account for the influence its ads have across the entire customer journey. GA4’s default model, on the other hand, is laser-focused on that final touchpoint.
Your goal isn't to make the numbers match perfectly. They won't. The key is to understand why they differ and then choose one platform as your primary source of truth for conversions. This ensures your reporting stays consistent.
Establishing Your Single Source of Truth
To calculate a CPA you can actually bank on, you need rock-solid conversion tracking. This is completely non-negotiable.
For Meta campaigns, that means correctly implementing both the Meta Pixel and the Conversions API (CAPI). The Pixel tracks what users do on your website, while CAPI sends conversion data directly from your server to Meta's. Using them together creates a much more resilient tracking system that isn’t as easily thrown off by browser restrictions or ad blockers. If you need a hand, our guide on how to set up the Facebook Pixel walks you through it step-by-step.
Ultimately, picking your source of truth comes down to your business goals and philosophy. If you believe strongly in Meta's ability to influence purchases across the funnel, using its reported numbers is a perfectly valid approach. If you prefer a more conservative, last-touch view of the world, GA4 might be your go-to.
The most important thing is to be consistent. Pick one, document why you chose it, and stick with it for all future calculations.
Using CPA Segmentation to Find Hidden Wins
Calculating a single, account-wide Cost Per Acquisition is a decent starting point, but let’s be honest—it’s mostly a vanity metric. It can look good on a report, but it often hides serious problems just beneath the surface. The real magic happens when you start segmenting that data.
True optimization isn’t about your average CPA; it’s about understanding the individual CPAs that make up that average. This is where you find the hidden wins that turn good campaigns into great ones. By breaking down your performance, you can stop feeding the losers and start scaling the winners.
Uncovering Performance by Audience and Creative
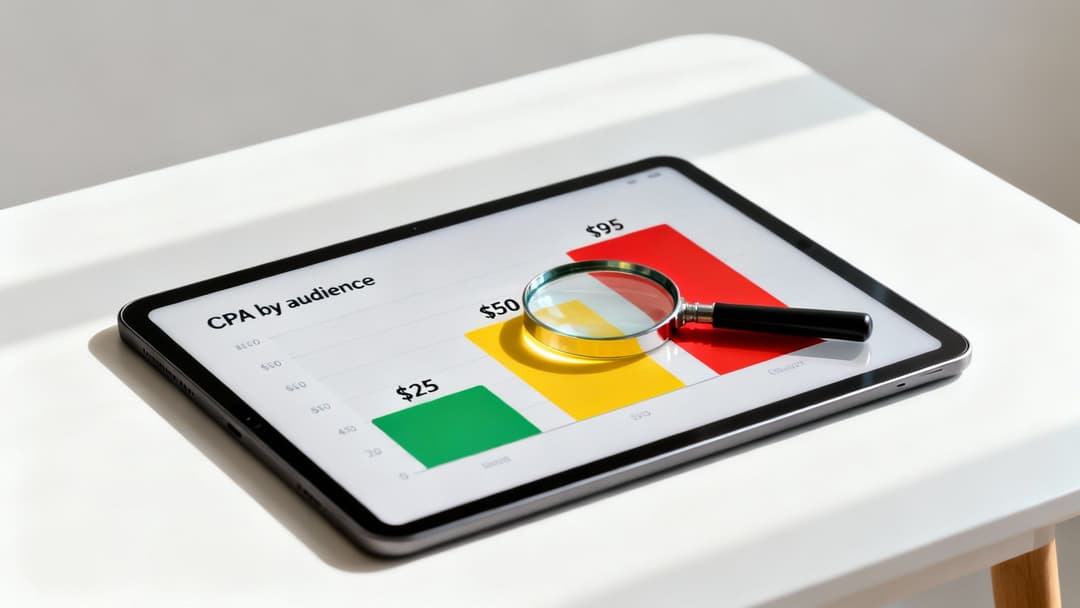
Let me walk you through a classic e-commerce scenario I’ve seen countless times. A clothing brand is running ads on Meta and proudly reporting an average CPA of $50. On the surface, that might seem totally acceptable for their margins.
But once they dig deeper, a completely different story emerges.
The brand is running two main ad sets:
- "Loyal Customers" Lookalike Audience: This group is bringing in sales at a fantastic $25 CPA.
- "Broad Interests - Fashion" Audience: This group is converting at a staggering $95 CPA.
That blended average of $50 completely masked the truth. The lookalike audience was a goldmine, while the broad interest group was draining nearly four times the budget for every single sale. Without segmentation, the marketing team might have kept splitting the budget evenly, unknowingly torching thousands of dollars.
The same logic applies to your individual ad creatives. You might find that a scrappy, user-generated video ad is converting at $30, while a polished studio graphic is costing you $70 per sale. These insights are pure optimization fuel, showing you exactly where to shift your budget for an immediate lift in ROI. Mastering this level of detail is a core part of building a strong foundation in performance analytics for ads.
How to Segment Your CPA in Practice
Putting this granular approach into practice is more straightforward than it sounds. Inside your ad platform, like Meta Ads Manager, just use the "Breakdown" feature. This lets you slice your performance data by:
- Campaign: Identify which objectives are the most cost-effective.
- Ad Set: See which specific audiences and placements are delivering the goods.
- Ad: Pinpoint the exact creative and copy that actually resonates with people.
By regularly reviewing these segmented views, you can confidently turn off the ads and ad sets that are bleeding cash and reallocate that budget to your proven top performers.
The goal here is to create a constant feedback loop. You launch campaigns, segment the CPA data to find the winners, and then double down on the creative styles, audiences, and messages that are actually working.
Extending Segmentation Across Channels
This analysis shouldn't be stuck inside a single platform, either. The next pillar of smart calculation is breaking down your CPA by marketing channel. The formula is the same simple concept—total spend for a channel divided by the acquisitions from that channel—but the insights you get are profound.
Looking at global data, you'll see massive differences. For example, the average direct-to-consumer e-commerce brand might see a $70 customer acquisition cost, while a fintech SaaS company can see that number skyrocket to $1,450. Recent analyses all point to the same thing: find your low-CPA heroes. A fashion brand might acquire customers for $150 on Meta, while a B2B SaaS company pays $300 through display ads. You can dig into more of these numbers and see how you stack up against customer acquisition cost benchmarks on genesysgrowth.com.
So, you’ve calculated your Cost Per Acquisition. Now for the million-dollar question: "Is this number any good?"
A CPA figure floating in a vacuum doesn't tell you much. It only starts to make sense when you put it in context. Benchmarking is how you do that.
It’s tempting to immediately stack your number up against broad industry averages, but be careful—that can be a bit of a trap. A "good" CPA for a high-ticket B2B software company would be absolutely catastrophic for a fast-fashion e-commerce brand. These benchmarks are useful for getting a general feel for the landscape, but they don’t tell your company’s unique story.
Mastering CPA is all about turning raw data into a smart, actionable strategy. It's a continuous process. Globally, the cost to acquire a customer shot up a staggering 222% over eight years. The spread across industries is just as wild: an e-commerce brand might see a CPA between $70 and $100, while a B2B manufacturer could be looking at $723. You can dig into more of this data on how these acquisition costs have evolved on amraandelma.com.
Your Most Important Benchmark Is You
Your own historical data is the single most powerful benchmark you have. While industry numbers are interesting, the real measure of success is your progress over time. The goal isn't just to calculate your CPA; it's to consistently improve it.
Let's say you just rolled out a creative refresh for your Meta campaigns. Before the update, your CPA was consistently around $60. A month after launching the new ads, you run the numbers again and find your CPA has dropped to $48.
That's a 20% month-over-month decrease. Whether the industry average is $30 or $80, this is a clear win. It’s tangible proof that the changes you made are making your ad spend more efficient.
This kind of internal benchmarking is how you build a repeatable system for growth. It shifts the entire conversation from "Is our CPA good?" to "How did we just make our CPA better, and how can we do it again?"
Of course, to track this progress effectively, it helps to see how different industries generally perform and understand the variables that push their costs up or down.
Sample CPA Benchmarks by Industry
To give you a broader sense of the terrain, here are some typical CPA ranges across a few common industries. Think of this as a map of the landscape—it shows you where you are, but not the specific path you need to take.
| Industry | Average CPA Range | Key Influencing Factors |
|---|---|---|
| E-commerce/DTC | $40 - $120 | Average Order Value, product margins, seasonality |
| B2B SaaS | $200 - $600+ | Sales cycle length, subscription price, market competition |
| Lead Generation | $50 - $250 | Lead quality requirements, industry competitiveness |
Ultimately, external benchmarks give you the lay of the land, but your historical data provides the turn-by-turn directions. The real game is won by focusing on beating your own last performance. Do that consistently, and you'll build a more profitable business over time, no matter what the averages say.
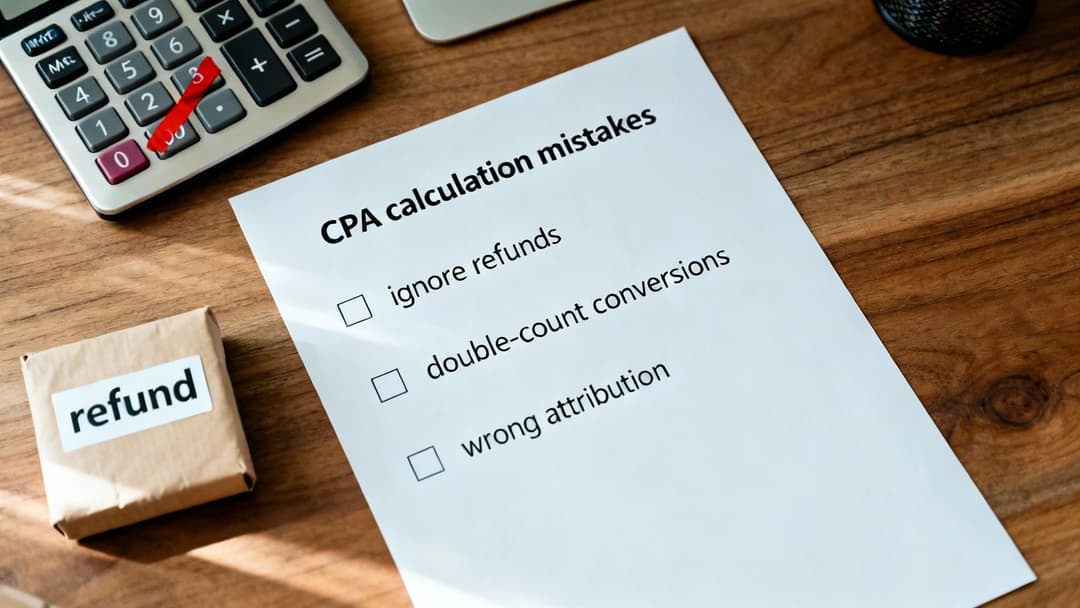
Common CPA Calculation Mistakes to Avoid
We’ve all been there. You think you’ve got a winning campaign, the numbers look great, and you’re ready to pour more money into what’s working. But bad data leads to bad decisions. When you’re calculating your CPA, even a tiny mistake can completely warp your understanding of profitability, causing you to scale the losers and kill the winners.
Let’s walk through some of the most common pitfalls I see marketers fall into. Steering clear of these is critical if you want your CPA to be a reliable guide, not a misleading distraction.
One of the sneakiest culprits, especially for e-commerce brands, is forgetting to account for returns and refunds. A campaign might look amazing on paper, but if 20% of those "acquisitions" are sent back a week later, your real CPA is much higher than you think.
Confusing Acquisition with Interest
Another major point of confusion is the classic mix-up between Cost Per Acquisition (CPA) and Cost Per Lead (CPL). They sound similar, but they measure completely different things. Getting them wrong will throw your entire strategy off course.
- Cost Per Lead (CPL): This is your top-of-funnel metric. It measures the cost to get someone to show interest—think an email signup, a form fill, or a guide download.
- Cost Per Acquisition (CPA): This is your bottom-of-funnel, money-in-the-bank metric. It measures what you spent to get an actual paying customer.
A super low CPL is great, but it’s a vanity metric if those leads never buy anything. You have to use the right tool for the job. Use CPA for your sales campaigns and CPL for lead gen. This simple distinction keeps your goals clear and your reporting honest.
The Dangers of Double Counting and Attribution Windows
Double-counting conversions is an incredibly easy trap to fall into, especially when you’re running ads on multiple platforms.
Here’s a classic scenario: Meta Ads takes credit for a sale because a user saw an ad, but Google Analytics attributes that same sale to organic search because it was the last click. Suddenly, one sale looks like two. This happens because each platform has its own attribution rules.
Meta often defaults to a 7-day click, 1-day view window. This means it can claim credit for a sale if someone just viewed your ad and then bought something within 24 hours, without ever clicking. If you're not aware of this, it's easy to see why platform numbers can feel inflated. Understanding what a view-through conversion is helps clear up a lot of this confusion.
To get a clear picture, you need a single source of truth. Pick one—your ad platform, Google Analytics, your CRM, or a third-party tool—and stick to it for reporting. This stops you from counting the same customer twice and making your CPA look artificially low.
Factoring in Returns for a True CPA
For any business selling physical goods, ignoring returns is like trying to balance your checkbook while pretending some of your checks won't be cashed. Your true CPA has to reflect the reality of refunds.
Let's break it down with a quick example:
- Ad Spend: $5,000
- Initial Acquisitions: 100 sales
- Initial CPA: $5,000 / 100 = $50
Looks pretty good, right? But hold on. Over the next 30 days, 15 of those customers return their orders.
- Net Acquisitions: 100 - 15 = 85 sales
- True CPA: $5,000 / 85 = $58.82
That’s a nearly 18% jump in your actual cost to acquire a customer. By getting into the habit of recalculating your CPA after your typical return window closes, you’ll have a much more honest and actionable number to guide your budget.
Connecting CPA to Your Business Health
Calculating your Cost Per Acquisition is a critical first step, a quick health check for your marketing pulse. But here’s something I’ve seen trip up countless marketers: treating CPA as the final verdict on their success.
It's easy to get tunnel vision. A low CPA feels like an obvious win, but it’s a hollow victory if the customers you’re bringing in don’t stick around. The real goal isn't just cheap acquisitions; it's connecting those costs to genuine, long-term profitability.
This is where the conversation shifts from a simple cost metric to a strategic one. You have to start asking the most important question: are we buying profitable growth, or are we just buying expensive attention? A campaign that reels in one-time buyers with a $20 CPA could be bleeding you dry compared to one that acquires loyal subscribers at a $70 CPA.
The Ultimate Health Metric: LTV to CPA Ratio
So, how do you know if your CPA is actually sustainable? You need to bring Customer Lifetime Value (LTV) into the picture. LTV is the total revenue you can reasonably expect to earn from a single customer over their entire relationship with your brand.
When you compare these two metrics, you get the LTV:CPA ratio—the ultimate indicator of your business’s health. It tells you exactly how much value you're generating for every single dollar you spend to get a customer through the door.
A healthy, sustainable business typically aims for an LTV:CPA ratio of at least 3:1. For every $1 you spend to acquire a customer, you should be generating at least $3 in lifetime value. This 3:1 benchmark ensures you've covered your acquisition costs and have a solid margin left over for profit and all your other operational expenses.
Grasping this ratio completely changes how you look at your marketing budget. Suddenly, it’s not just an expense line item; it’s a direct investment in future revenue streams. We dive deeper into connecting marketing spend to financial outcomes in our guide on how to calculate marketing ROI.
Ultimately, managing your CPA effectively is about fine-tuning your marketing spend to boost overall business health. The principles of smart cost management aren't just for marketing, either—they're the same ideas behind things like effective procurement cost reduction strategies. By shifting your focus to the LTV:CPA ratio, you move beyond the tactical game of chasing cheap clicks and start building a truly resilient business.
Your Top CPA Questions, Answered
Even after you’ve got the formula down, the real world of performance marketing always throws a few curveballs. Here are the most common questions that come up when marketers start tracking Cost Per Acquisition, along with some straight-to-the-point answers from our experience.
What Is a Good Cost Per Acquisition?
Honestly, there's no single magic number for a "good" CPA. The real answer? It's all relative to your business model, your margins, and, most importantly, your customer lifetime value (LTV).
A solid rule of thumb we always come back to is aiming for an LTV to CPA ratio of at least 3:1. For every dollar you spend to bring a customer in the door, you should be making at least three dollars back from them over time. Anything less, and your profitability is on shaky ground.
- For a direct-to-consumer brand selling a low-priced product, a good CPA might be anything under $30.
- But for a high-ticket B2B SaaS company, a CPA north of $500 could be incredibly profitable.
The goal isn't to chase some arbitrary industry benchmark. It's about deeply understanding the math behind your own business—what you spend versus what you earn.
How Often Should I Calculate My CPA?
The right cadence really depends on how fast your campaigns are moving and what you're trying to achieve.
For fast-paced campaigns on dynamic platforms like Meta Ads, you should be glancing at your CPA daily, or at least every few days. This lets you spot trouble early and make quick tweaks to budgets or creatives before you burn through your cash.
Beyond that, a more formal, in-depth CPA review should happen weekly. This is where you zoom out a bit, look for trends, and make bigger strategic calls. And of course, a monthly and quarterly review is crucial for high-level planning and seeing how you’re stacking up against your own historical data.
My CPA Is Too High. What Should I Do First?
If you see your CPA start to creep up, don't panic. The key is to diagnose the problem systematically instead of just randomly changing things.
First, take a hard look at your ad creative and copy. Is your message still hitting the mark, or are people getting tired of seeing the same old ad? Ad fatigue is real. A/B testing a few new creative angles can often give you a quick win.
Next, get granular with your audience targeting. You might be aiming too broadly and wasting spend on clicks that will never convert. Try narrowing your audience with more specific interests, or test out new lookalike segments based on your absolute best customers.
Don't forget to audit your landing page. I've seen so many campaigns with amazing ads fall flat because of a clunky, slow, or confusing landing page. A bad user experience will absolutely murder your conversion rate and send your CPA into orbit. Make sure your page loads fast and the offer perfectly matches the promise you made in the ad.
Ready to stop guessing and start scaling? AdStellar AI automates the entire ad creation, testing, and optimization process on Meta. Launch hundreds of ad variations in minutes and let our AI pinpoint the winning combinations to drive down your CPA and maximize your ROI. Learn how you can build better campaigns, faster.