Calculating your Return on Ad Spend (ROAS) is pretty straightforward: just divide the total revenue you pulled in from your ads by the total amount you spent to run them.
That simple number tells you exactly how much money you’re making for every single dollar you put into advertising. Think of it as the ultimate health check for your marketing.
Why ROAS Is the Metric That Actually Matters
It’s incredibly easy to get lost in a sea of marketing metrics. We obsess over clicks, impressions, and click-through rates (CTR), and while they all tell a piece of the story, ROAS tells you the most important part: are your ads actually making money?
It draws a direct line from your ad budget to your company’s bottom line.
Let's say you're an e-commerce brand that just launched a new campaign on Meta Ads. You spent $1,000 and generated 500 clicks. On the surface, that sounds pretty good. But what if those clicks only led to $800 in sales? Your ROAS would be 0.8, meaning you actually lost 20 cents for every dollar you spent. ROAS cuts straight through the vanity metrics to answer the only question that really matters.
Proving Your Marketing Impact
ROAS isn't just for your own analysis; it’s the key to proving marketing's value to executives, clients, or anyone else holding the purse strings. It translates all your hard work into the one language everyone in business understands—money.
This kind of clarity is crucial for a few big reasons:
- Smarter Budgeting: You can confidently ask for more budget when you can show exactly which campaigns are delivering a solid return.
- Strategic Scaling: It gives you the green light to double down on the ads, audiences, and creative that are already winning.
- Quick Optimization: It immediately flags underperforming campaigns that need to be tweaked or shut down before they burn more cash.
ROAS isn’t just a number you report on at the end of the month. It's a strategic tool. It gives you the power to make data-backed decisions that directly fuel growth, turning your ad spend from a simple expense into a powerful investment.
Setting Realistic Benchmarks
So, what’s a “good” ROAS? While it varies wildly by industry, profit margin, and business goals, there are some general benchmarks to keep in mind.
To give you a clearer picture, here's a quick reference guide:
ROAS Quick Reference Guide
| Metric/Concept | What It Means | Good Benchmark |
|---|---|---|
| Below 100% (1:1) | You're losing money on your ad spend. For every $1 spent, you're making less than $1 back. | This is almost always a sign to pause and re-evaluate your campaign. |
| 200%-300% (2:1-3:1) | You're likely breaking even or slightly profitable after accounting for all other business costs. | A common starting point for many businesses, especially in competitive markets. |
| 400% (4:1) or more | This is widely considered a strong, healthy return, indicating solid profitability. | An excellent target for most e-commerce and direct-response campaigns. |
A ROAS of 400% (a 4:1 ratio) is a fantastic target for most businesses, suggesting a very healthy and profitable campaign. If you want to dive deeper into industry-specific numbers, you can find more benchmarks in this Return on Ad Spend analysis on Umbrex.
This table helps set expectations, but remember that your "good" ROAS will depend entirely on your own profit margins and operating costs.
Finally, while ROAS is laser-focused on the direct return from ad spend, it's just one part of a bigger financial picture. To understand how your marketing efforts contribute to overall business profitability, you'll want to check out our guide on how to calculate marketing ROI. It helps connect the dots between ad performance and true business success.
Mastering The Core ROAS Formula
At its heart, the formula for Return on Ad Spend is refreshingly simple. It’s designed to give you a quick, clear answer to the most important question: “For every dollar I put into ads, how many dollars did I get back?” You don't need a crazy complex spreadsheet just to get a baseline read on performance.
The fundamental calculation is as straightforward as it gets. You just divide your total revenue from advertising by your total ad cost. That’s it. This simple number is invaluable for allocating your budget, and looking at historical ROAS data is a goldmine when you're trying to forecast future ad spend.
This quick diagram shows you the basic flow of how your spend and revenue inputs come together to give you your final ROAS.
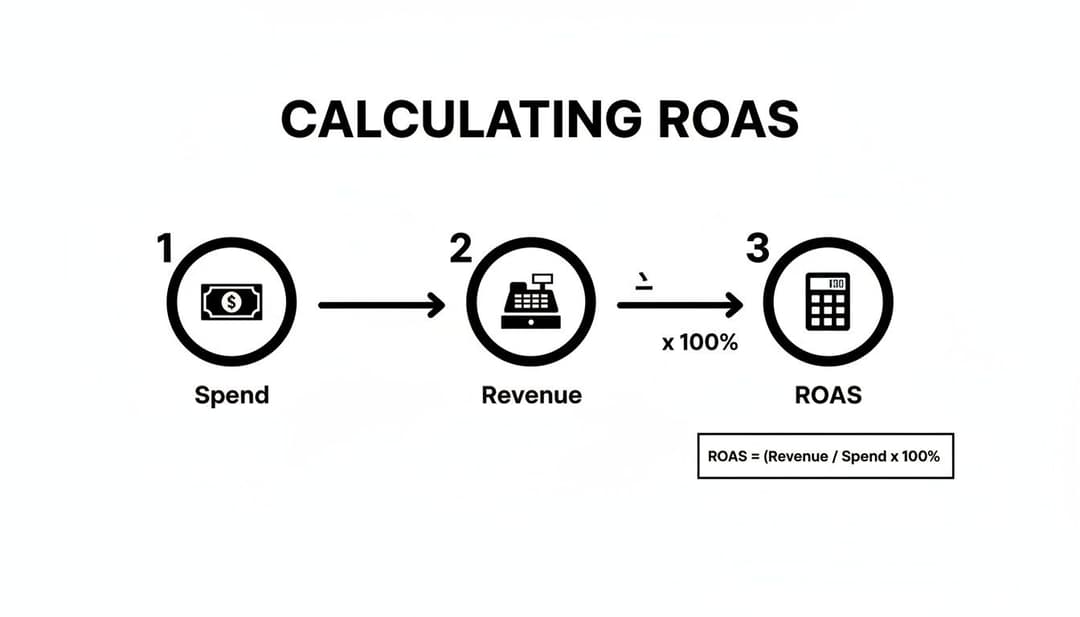
As you can see, the process flows from identifying what you spent and what you earned right into the final calculation, highlighting the direct link between your investment and its return.
What To Include In Ad Spend
This is where a lot of marketers get it wrong. They only count the direct platform spend—the cash they handed over to Meta or Google. This gives you an inflated, wildly inaccurate view of your true return.
A "fully-loaded" ad cost gives you a much more honest picture. Make sure you’re including:
- Platform Spend: The money paid directly to the ad network (e.g., Meta, Google). This is the obvious one.
- Agency Fees: If you're working with an agency, their retainer or commission is a direct cost of running those ads.
- Creative Production: Don't forget the costs for designers, copywriters, or video editors who actually create the ads.
- Software & Tools: Any subscription fees for ad management, analytics, or creative platforms count, too.
If you skip these costs, you aren't calculating your real ROAS. To get a true handle on your advertising performance, you have to get these fundamentals right. For a deeper dive, check out this guide on What Is Return on Ad Spend and How to Master It for E-Commerce.
A Practical ROAS Calculation Example
Let's walk through a real-world scenario. Imagine a direct-to-consumer (DTC) brand that ran a Meta campaign for a new product launch last month.
Here's a breakdown of their numbers:
- Revenue from Ads: $20,000 (pulled straight from the purchase conversion value in their Meta Ads Manager).
- Meta Ad Spend: $4,000.
- Agency Retainer: $1,500.
- Creative Asset Costs: $500 for a freelance video editor.
Their total, fully-loaded ad cost comes out to $6,000 ($4,000 + $1,500 + $500).
Now, let's plug that into the formula.
The Calculation:
ROAS = ($20,000 Revenue / $6,000 Total Ad Spend)
ROAS = 3.33 or 333%
This tells them that for every single dollar they truly invested in this campaign, they generated $3.33 in return. This number is far more useful for making business decisions than the 5.0x ROAS they would have seen using only the platform spend.
This distinction is crucial because it directly impacts profitability. Getting your costs straight is also a foundational step when you calculate cost per acquisition for your campaigns.
Finding Your ROAS Data in Meta Ads Manager
Okay, let's move from theory to practice. Calculating your ROAS is pretty straightforward once you know where to look, and for most of us, that starts inside Meta Ads Manager. This is ground zero—where all your ad spend and revenue data lives, just waiting to tell you what’s actually working.
You're hunting for two key metrics: Amount Spent and Purchase Conversion Value. The first one is easy; it’s the total cash you’ve handed over to Meta to run your ads. The second, Purchase Conversion Value, is the total revenue your ads generated from purchases tracked by the Meta Pixel or Conversions API. These two numbers are the heart of your ROAS calculation.
Customizing Your Ads Manager View
Right out of the box, Meta’s dashboard probably isn't set up to give you the full picture. You'll need to tweak the columns to see your spend and purchase value side-by-side, which is the fastest way to get a pulse on performance.
Just head to the Columns dropdown in Ads Manager and hit Customize Columns. From there, you can search for and add these essentials to your report:
- Amount Spent: The total cost of your ads, pulled directly from the platform.
- Purchase Conversion Value: The total revenue attributed to your campaigns.
- ROAS (Purchase): Meta even has its own pre-calculated ROAS metric. It's a great way to double-check your own math.
Once you save this view as a preset, you'll have a custom report ready to go. You can instantly see your ROAS at the campaign, ad set, or even the individual ad level.
Automating ROAS Calculation and Analysis
Pulling these numbers manually is fine when you're only running a few campaigns. But it becomes a soul-crushing, error-prone task when you’re testing hundreds of ad variations. This is where modern tools completely change the game. An AI-powered platform like AdStellar brings all your metrics into one place, automating the entire ROAS calculation for you.
Instead of digging through columns and exporting spreadsheets, you get an intuitive dashboard that instantly shows you how every single creative is performing. This helps growth teams spot their winning ads in minutes, not hours.
With all your data centralized like this, you can immediately see which creatives are driving the highest return. That means you can make faster, more confident decisions about where to put your budget.
Key Takeaway: Meta Ads Manager gives you the raw data, but dedicated platforms cut out all the manual work. They surface insights much faster, letting you focus on strategy and scaling your winners instead of getting lost in data entry.
Automating your analysis is a massive step up for any serious growth team. It shifts your focus from just finding data to actually acting on it. For a deeper dive into locating metrics across different ad platforms, check out our complete guide on where to find ad performance data. This ensures your team is always working with the most accurate and actionable information to fuel smarter, more profitable advertising.
Getting Real About Attribution and Conversion Windows
Let's be honest: calculating your return on ad spend is almost never as clean as plugging two numbers into a formula. The real story—and the accuracy of your ROAS—lives and dies by your attribution settings.
This is a detail that trips up a surprising number of marketers, leading them to completely misread their campaign performance. These settings are simply the rules that platforms like Meta use to decide which ad gets the credit for a sale, and for how long.
The two big levers here are the attribution model (what counts as a conversion-driving action, like a click versus just a view) and the conversion window (the timeframe where that action is eligible for credit). Nail these, and your data starts to make sense. For instance, some sales happen after someone sees an ad but never clicks. If you're curious about that, we've got a whole guide on understanding view-through conversions.
Choosing The Right Conversion Window
When you’re in a platform like Meta Ads Manager, you'll see options like a 1-day click or a 7-day click window. The difference isn't minor—it's massive.
A 1-day click window is exactly what it sounds like: Meta only gives your ad credit for a sale if the purchase happens within 24 hours of the click. For an impulse-buy product, like a trendy phone case, this usually works just fine. The path to purchase is short and sweet.
But what if you’re selling custom furniture or a high-ticket B2B service? The customer journey is way longer. They'll research, compare prices, and think it over. Using a 1-day click window here would be a disaster. You'd miss out on crediting every single conversion that happens on day three, five, or six. For these scenarios, a 7-day window gives you a much more realistic picture of your ad's actual influence.
The goal isn't to pick the longest window just to inflate your ROAS. It's about matching your attribution settings to how your customers actually buy. A mismatch gives you data that’s technically correct but strategically useless.
Complex Customer Journeys
Things get even more complicated when you're running ads on multiple platforms. If a customer sees your ad on Meta but ends up buying on Amazon, how do you connect those dots?
Accurately calculating ROAS across these complex journeys means you need to bridge those data gaps. There are some great resources that explain tools like Amazon Attribution and its role in connecting Meta Ads to Amazon sales, which helps create a more unified view of what’s really working.
Ultimately, your attribution window defines the story your data tells. A shorter window highlights immediate impact, while a longer one captures those delayed conversions and paints a fuller picture of your ad’s influence over time. Picking the right one means your ROAS calculation actually reflects reality, allowing you to make smart, informed decisions with your ad budget.
Costly ROAS Calculation Mistakes to Avoid
Getting your return on ad spend right is the bedrock of a scalable marketing strategy. But it's alarmingly easy to mess up. A simple misstep in your calculation can turn a promising metric into a dangerously misleading one.
I've seen it happen time and time again: a flawed calculation leads a team to either scale an unprofitable campaign into the ground or kill a potential winner just before it takes off. These aren't just minor accounting errors; they’re strategic blunders that can drain your budget in a hurry.
The accuracy of your ROAS depends entirely on the numbers you feed the formula. One of the biggest mistakes I see is marketers relying solely on the top-line revenue figures that ad platforms spit out. Let's break down why that's a problem.
Forgetting About Profitability
This is the big one. A positive ROAS does not automatically mean your business is profitable. It's the most dangerous assumption you can make.
A 400% ROAS feels like a massive win, right? But if your product only has a slim 20% profit margin, you're actually losing money on every single sale driven by that ad.
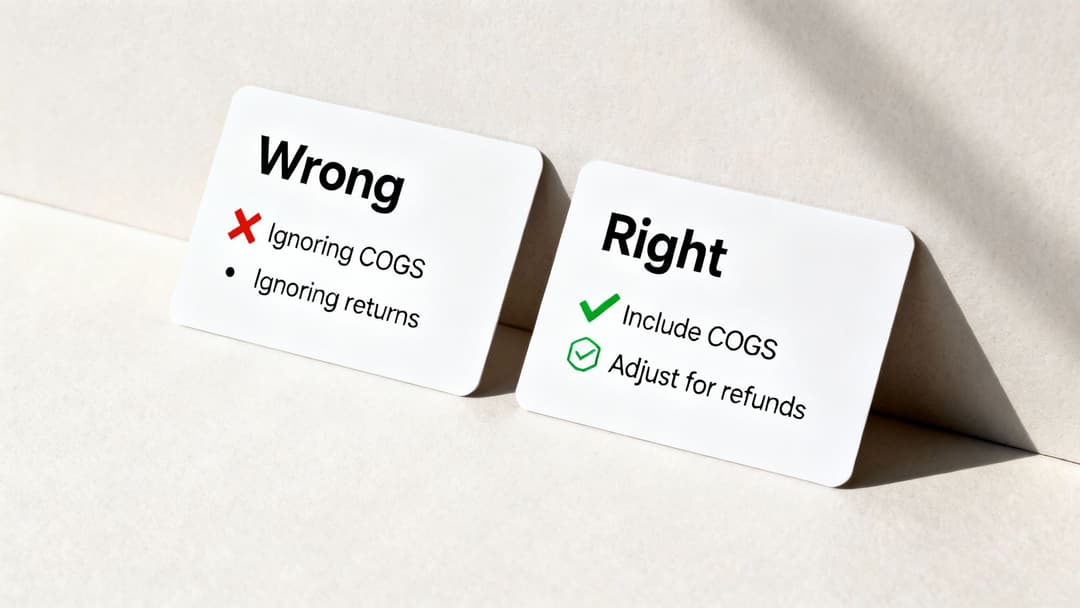
The usual suspect here is the Cost of Goods Sold (COGS), which covers all the direct costs of your product, like manufacturing and materials. Ignoring COGS paints a completely false picture of success.
What Not To Do: Calculating ROAS using only gross revenue. A campaign generating $10,000 in revenue from $2,500 in ad spend looks like a solid 4x ROAS on paper.
What To Do Instead: Factor in your actual profit margin. If your profit margin is 25%, that $10,000 in revenue is only $2,500 in real profit. Your campaign isn't thriving; it's just breaking even.
Ignoring Returns and Refunds
Another classic pitfall is forgetting to account for customer returns and refunds. Your ad platform reports the initial sale with a celebratory ping, but it has no idea when a customer sends that product back a week later.
This oversight inflates your revenue numbers and, by extension, your ROAS.
- The Mistake: You celebrate a $5,000 revenue day from a campaign that cost $1,000. That's a 5x ROAS!
- The Reality: The following week, $1,500 of those sales are refunded. Your actual revenue is only $3,500, which drops your true ROAS to 3.5x.
To get an accurate number, you have to subtract returns from your total revenue before you calculate ROAS. This extra step ensures your decisions are based on the money that actually stays in your bank account.
Optimizing in a Vacuum
Focusing only on ROAS without considering other vital business metrics is like trying to drive while only looking at the speedometer. It's incredibly shortsighted.
A high ROAS on a low-priced item might look great, but a campaign with a lower ROAS that acquires customers with a high Customer Lifetime Value (LTV) could be far more valuable in the long run.
The scale of global advertising, which recently passed $1.08 trillion, shows that businesses are confident in getting measurable returns, but that also makes smarter, more nuanced optimization more critical than ever. You can read the full report on WARC to see just how big the game has gotten.
Thinking beyond the immediate return is the key. Real success comes from balancing short-term ROAS with long-term, sustainable profitability. To get a complete view, check out our guide on how to measure ad effectiveness to see how you can connect your ROAS figures to your broader business goals.
Common Questions We Hear About ROAS
Even when you feel like you've got the basics down, some tricky questions always seem to pop up the moment you start digging into your own campaign data. Let's walk through a few of the most common ones I hear from marketers.
Getting these details right is what separates a vanity metric from a KPI that actually drives smart, profitable decisions for your business.
What Is a Good ROAS to Aim For on Meta Ads?
You’ll often hear 4:1 (or 400%) tossed around as the gold standard, but honestly, there's no magic number. A "good" ROAS is completely relative to your business's profit margins.
A luxury brand with sky-high margins could be incredibly profitable with a 3:1 ROAS. On the flip side, an e-commerce store with razor-thin margins might need to hit a 10:1 ROAS just to keep the lights on.
The only way to know for sure is to calculate your break-even ROAS. It's a simple formula: 1 / profit margin. If your profit margin is 25% (0.25), your break-even ROAS is 4 (1 / 0.25). This tells you that anything below a 4:1 return means you're actively losing money on your ads.
Use that break-even number as your absolute floor. From there, you can set realistic goals that actually align with your profitability targets.
How Do I Calculate ROAS for a Lead Generation Business?
This is a great question, especially for businesses that don't sell a product directly from an ad click, like a SaaS company or a service provider. The trick is to assign a monetary value to each lead, which requires just one extra step.
You'll need to figure out two things first:
- Lead-to-Customer Conversion Rate: Out of all the leads you get, what percentage actually become paying customers?
- Average Customer Lifetime Value (LTV): How much revenue does a typical customer generate over their entire relationship with you?
Let's run through a quick example. Say your average customer LTV is $5,000, and your lead-to-customer conversion rate is 10%. That means, on average, every single lead is worth $500 to your business ($5,000 * 0.10).
Now you can plug that $500 lead value right into your ROAS formula as the "Revenue." If you spent $2,000 on a campaign that brought in 10 new leads, your total generated value is $5,000 (10 leads * $500). That gives you a healthy 2.5:1 ROAS ($5,000 / $2,000).
Should I Focus on ROAS or CPA?
Ah, the classic debate: ROAS vs. CPA. The truth is, you need both. They're two different lenses that tell you different things about your performance.
- CPA (Cost Per Acquisition) is all about cost efficiency. It tells you the exact price you're paying to land one new customer. It's fantastic for managing your budget and making sure you aren't overspending on acquisitions.
- ROAS (Return on Ad Spend) is about revenue efficiency. It draws a direct line from your ad spend to the top-line revenue it brings in, making it the ultimate indicator of profitability.
For most e-commerce and DTC brands, ROAS is the North Star metric because the transaction happens right away. For a lead-gen or subscription business, CPA might feel more immediate and easier to track.
My advice? Don't pick one. Use CPA to keep your acquisition costs in check, but always connect it back to ROAS by factoring in your LTV. That's how you get the full, long-term picture of your financial health.
Ready to stop guessing and start scaling? AdStellar AI automates your Meta ad creation, testing, and analysis, giving you instant clarity on your ROAS for every creative and audience. Launch hundreds of ad variations in minutes and let our AI pinpoint your winners so you can double down on what’s working, faster. Transform your Meta ad performance with AdStellar AI today.