
You open analytics, see traffic moving, and still can’t answer the question that matters: what is this audience worth?
That’s where most website ads revenue calculator tools disappoint. They turn pageviews into a neat estimate, but they don’t think like a media buyer. They assume all visits monetize the same way, all ad slots perform the same way, and all traffic has equal intent. In practice, none of that holds up.
A better approach is to treat on-site ad inventory the way you treat paid media. You forecast it, segment it, pressure-test it, and optimize it against business outcomes. If you already use tools like a breakeven ROAS calculator to decide what traffic acquisition can afford to cost, the same mindset applies to monetization on your own site. Traffic is not just a top-line metric. It’s inventory with yield.
That’s why a useful website ads revenue calculator isn’t a widget. It’s a model. And if you understand the mechanics behind ad pricing, engagement, and traffic quality, you’ll forecast revenue far more accurately than any generic estimator. For a practical refresher on the pricing side, AdStellar’s guide to cost per 1000 impressions is a helpful companion because it grounds monetization in the same unit economics performance teams already use.
Beyond Guesswork How to Forecast Your Ad Revenue
The usual scenario looks like this. A marketer sees a steady rise in sessions, plugs a traffic number into a calculator, gets an exciting revenue estimate, and starts making plans around it. A month later, actual earnings come in lower, and nobody can explain the gap.
That gap usually comes from missing context. The tool asked for traffic, maybe pages per visit, maybe an RPM assumption. It didn’t ask whether the audience came from branded search, from a low-intent paid social audience, or from returning visitors who scroll deep enough to see ads. It also didn’t ask whether the ad layout helps or hurts click behavior.
Practical rule: A forecast is only useful if you can explain which input moved and why revenue changed.
Performance marketers already know this logic from acquisition. You don’t judge a Meta campaign on spend alone. You look at creative, audience, placement, conversion rate, and margin. Website monetization works the same way. Revenue is the output. Traffic quality, ad visibility, and pricing are the inputs.
A strong website ads revenue calculator model does three things well:
- Starts with observed traffic: Use your own analytics baseline, not a best-case month.
- Separates value drivers: Don’t lump pageviews, click behavior, and pricing into one vague multiplier.
- Leaves room for optimization: A forecast should show where layout changes, better engagement, or traffic mix shifts can improve results.
That’s the difference between passive guessing and active revenue management.
Decoding the Language of Ad Revenue
Before you can forecast ad revenue, you need clean definitions. Most mistakes happen because teams mix up advertiser metrics with publisher metrics, or they optimize for the wrong one.
The core metrics that actually matter
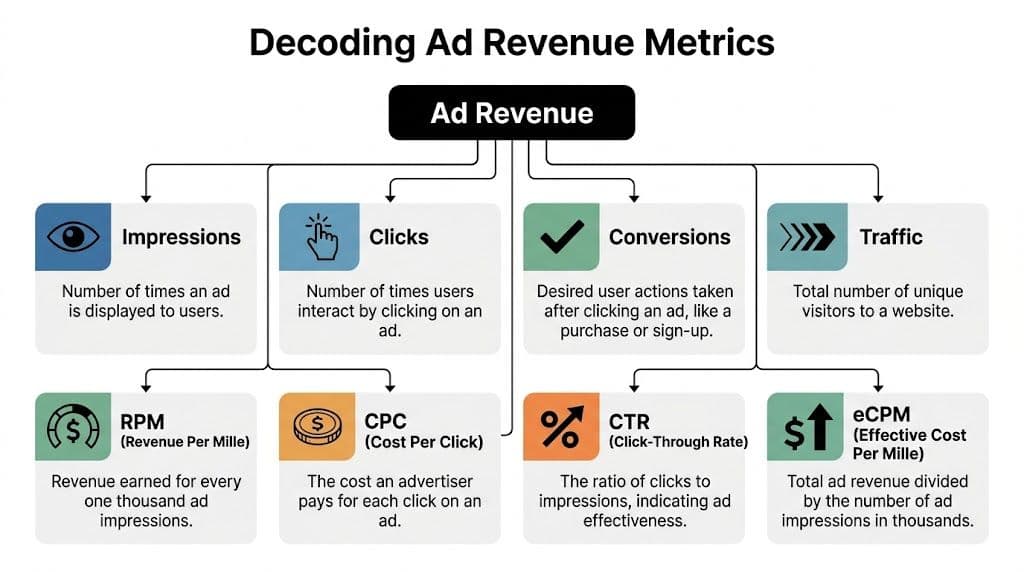
CPM measures the price paid per thousand ad impressions. You’ll usually see it in advertiser buying discussions or platform reporting.
RPM means revenue per thousand pageviews or revenue events, depending on the setup. For publishers, it’s often more useful than CPM because it reflects what the site actually earns.
CTR is click-through rate. Formula: clicks / impressions × 100. It tells you how often people click after seeing an ad.
CPC is cost per click. It’s the amount an advertiser pays when someone clicks.
eCPM is effective cost per thousand impressions. Formula: total revenue / impressions × 1,000. It normalizes earnings across campaigns or placements.
Fill rate tells you how much of your available inventory was actually filled with paid ads.
Viewability tells you whether the ad had a realistic chance to be seen, not just served.
If you want a quick parallel between monetization reporting and advertiser pricing language, AdStellar’s explanation of what CPM ads are is useful because it shows why CPM alone can mislead publishers.
Core Ad Revenue Metrics and Formulas
| Metric | What It Measures | Formula |
|---|---|---|
| CPM | Cost paid per thousand impressions | Cost / impressions × 1,000 |
| RPM | Revenue earned per thousand pageviews | Revenue / pageviews × 1,000 |
| CTR | Share of impressions that generate clicks | Clicks / impressions × 100 |
| CPC | Amount paid per click | Revenue / clicks |
| eCPM | Revenue per thousand impressions | Revenue / impressions × 1,000 |
| Fill Rate | Share of ad requests that get filled | Filled impressions / total ad requests |
| Viewability | Share of served ads that are viewable | Viewable impressions / measurable impressions |
How the metrics connect
These terms matter because they describe different parts of the same system.
Traffic creates pageviews. Pageviews create ad opportunities. Ad placements determine whether users see those opportunities. Viewability and placement affect CTR. CTR and CPC shape click-based revenue. RPM rolls all of that into one publisher-facing benchmark.
This is why RPM is often the most practical starting metric for forecasting. Niche-specific benchmarks vary widely. Generic content sites might see $10 to $15 RPM, while finance can reach $30 to $50 RPM because advertiser competition is stronger, according to The Website Flip’s ad revenue calculator methodology.
Where marketers get tripped up
The most common mistake is using CPM as if it were final revenue. It isn’t. A high CPM with weak viewability or poor fill can still produce disappointing earnings. Another mistake is treating CTR like a vanity metric. On content sites, CTR often reflects layout quality, audience intent, and relevance more than creative alone.
Here’s the simple way to understand it:
- Use RPM to benchmark your site’s monetization efficiency.
- Use CTR and CPC to understand what’s happening inside that RPM.
- Use viewability and fill rate to diagnose why earnings fall short of what traffic volume suggests.
A pageview only becomes valuable when an ad loads, gets seen, and attracts demand at a worthwhile price.
Once you start viewing these metrics as linked levers instead of isolated acronyms, a website ads revenue calculator stops being a guessing tool and becomes a working model.
Building Your Own Revenue Forecast Step by Step
A useful forecast starts in a spreadsheet, not a black box. The point isn’t to build something complicated. The point is to build something you can audit.

Set up columns for traffic inputs, monetization assumptions, and outputs. Keep the first version simple. Then add realism layer by layer.
Start with the RPM model
The fastest way to estimate site revenue is with RPM.
Use your average pageviews from a recent period, not your best spike. The methodology many practitioners use starts by averaging traffic over several months to avoid overvaluing one breakout week. Then apply a niche-appropriate RPM assumption.
The formula is simple:
Estimated revenue = (Pageviews / 1,000) × RPM
If you run a content site and you’re choosing between a broad benchmark and a niche benchmark, use the niche one. Broad averages are how forecasts get inflated.
A basic spreadsheet for this method needs only four fields:
- Monthly pageviews
- Estimated RPM
- Low-case revenue
- Base-case revenue
You can also add a high-case scenario, but only if you tie it to a real operational change like stronger placement, improved session depth, or better demand quality.
Useful habit: Build three scenarios. Conservative, base, and stretch. Then note what would need to happen operationally for each one to come true.
Add a second layer with CTR and CPC
RPM is efficient, but it hides detail. If you want to understand where revenue comes from, add a click-based view.
A common granular formula is Daily Pageviews × CTR × CPC. Using the worked example from Taboola’s ad revenue explainer, a site with 200,000 pageviews, 1% CTR, and $0.50 CPC would generate $100 per day, or $3,000 per month.
That formula is helpful because it exposes the levers:
- Pageviews show volume.
- CTR shows whether users interact.
- CPC shows the value of each interaction.
If revenue is soft, this model tells you where to look. If CTR is weak, check ad position, clutter, or user intent. If CPC is weak, check niche quality and advertiser demand. If both are weak, the issue is often traffic mix, not just monetization settings.
If you also forecast paid acquisition, using a planning tool like a Google Ads Calculator alongside your ad revenue sheet helps frame a fuller margin picture. It’s not the same revenue stream, but it forces the right question: is the traffic you’re buying producing value beyond the primary conversion path?
Build the sheet like an operator
Use separate tabs or sections for assumptions and actuals.
Here’s a practical structure:
| Sheet Area | What to Include | Why It Matters |
|---|---|---|
| Traffic inputs | Sessions, pageviews, pages per session | Separates volume from engagement |
| Revenue assumptions | RPM, CTR, CPC | Lets you test scenarios cleanly |
| Inventory quality | Viewability, fill assumptions | Adds realism to optimistic top-line estimates |
| Output summary | Daily, monthly, and scenario revenue | Makes the model useful for planning |
Keep assumptions editable. Don’t hardcode them in formulas. When someone asks why forecasted revenue changed, you want to point to one updated variable, not hunt through cells.
For teams still sorting out implementation basics, AdStellar’s guide on how to put ads on a website is a helpful operational primer because setup decisions affect every forecast you build afterward.
Add realism with viewability and traffic quality
Most spreadsheet estimates fail because they assume every pageview is equally monetizable. It isn’t.
Viewability matters. If users don’t scroll to the slot, that impression has less value. Traffic quality matters too. A pageview from a highly engaged visitor is not equivalent to a shallow bounce from a paid click with weak intent.
The practical adjustment is to reduce your optimistic baseline when inventory quality is weak. That doesn’t mean guessing blindly. It means pressure-testing the forecast against how the site behaves.
Here’s a simple review checklist before you trust the number:
- Traffic stability: Use an average period, not a spike.
- Engagement sanity check: Look at pages per session and bounce behavior qualitatively before accepting a top-line estimate.
- Placement review: Ask whether the highest-value ad units are being seen.
- Source segmentation: Separate organic, direct, referral, and paid traffic where possible.
A short walkthrough helps if you want to see a forecasting mindset in action:
Use the model to make decisions, not just estimates
A website ads revenue calculator is useful to a performance team.
Say your RPM forecast looks healthy, but the click-based model shows weak CTR. That points to placement and relevance issues. If the click model is solid but total revenue still disappoints, the problem may be viewability, fill, or traffic depth. If paid traffic grows pageviews but drags down overall monetization quality, you’ll catch it in segmented reporting instead of hiding it in one blended number.
That’s the benefit of building your own calculator. It doesn’t just tell you what revenue might be. It shows which operational lever deserves attention first.
Why Most Ad Revenue Calculators Get It Wrong
Most calculator tools are wrong for a simple reason. They confuse arithmetic with forecasting.
A tool can multiply pageviews by RPM and return a clean number in seconds. That doesn’t mean the number survives contact with the actual site. The actual environment includes blocked impressions, privacy shifts, seasonal demand swings, weak placements, and traffic sources that look good in volume but monetize poorly.

The traffic number is rarely the real inventory number
A basic website ads revenue calculator usually starts with visits or pageviews. That’s fine for a sketch. It’s weak for planning.
Existing calculators often produce unreliable projections because they ignore factors like ad blockers, which affect 30% to 40% of traffic globally, and the shift to cookieless targeting, which is expected to reduce CPMs by 15% to 25% in major markets, as discussed in this review of calculator limitations.
That means your reported traffic and your monetizable traffic aren’t always the same thing.
The fastest way to overestimate ad revenue is to assume every visit creates equal ad opportunity.
Seasonality changes the value of the same traffic
A lot of calculators treat January traffic and November traffic as equally valuable. Anyone who has managed budgets across quarters knows that’s not how ad markets work.
Q4 can lift CPMs sharply because holiday demand pushes competition higher. Then Q1 often resets lower as budgets pull back. If your calculator uses one static RPM for the whole year, your annual revenue forecast will be directionally useful at best and misleading at worst.
The practical fix is simple. Forecast by month or by quarter, not just annually. Even if you keep the same traffic estimate, you should pressure-test revenue under different demand conditions.
They ignore where the revenue leak actually happens
Most underperformance doesn’t come from the formula itself. It comes from what the formula leaves out.
Here are the common blind spots:
- Ad blockers: A slice of your audience may never see ads at all.
- Privacy changes: Less addressable targeting can depress what buyers are willing to pay.
- Placement quality: A below-the-fold unit may technically exist but still contribute less than expected.
- Traffic intent: Not every source produces the same depth, scroll behavior, or ad exposure.
If a calculator can’t account for those differences, treat its output as a rough ceiling, not a forecast you can budget from.
What works better than one-number estimates
A better model uses ranges and assumptions with visible logic.
Try this approach instead:
| Forecast Layer | Weak Model | Better Model |
|---|---|---|
| Traffic | Total visits only | Segmented traffic by source |
| Monetization | Single static RPM | RPM plus click-based checks |
| Inventory quality | Ignored | Viewability and fill review |
| Time | Annual flat average | Monthly or quarterly scenarios |
That structure is less elegant than a one-field widget, but it’s far more useful. It gives operators something they can improve.
If a forecast misses, you should be able to answer why. Bad calculators hide the why. Good forecasting surfaces it.
Connecting Website Ads to Your Paid Media Strategy
This is the part most monetization tools miss. They treat website ad revenue like passive income from anonymous traffic. Performance marketers know traffic is never anonymous in that sense. It has a source, a cost, an intent profile, and a post-click behavior pattern.
That matters because on-site ad monetization is part of your broader media economics. It may not be your primary goal, especially for e-commerce or SaaS, but it still changes the value of a visit.

Not all traffic should carry the same monetization assumption
Current tools ignore how paid traffic from platforms like Meta can inflate pageviews while often depressing RPM by 20% to 30% due to lower traffic quality, and they also miss that integrating campaign data can add meaningful monthly value for a DTC brand with 100k visitors from paid social, according to Omni Calculator’s discussion of hybrid monetization gaps.
That’s the key trade-off. Paid social can increase volume and drive more pageviews per user journey, but the resulting visits may not monetize like organic traffic. Some users bounce quickly. Some scroll less. Some click ads differently. Some campaigns attract lower-quality sessions than your branded or SEO traffic.
A calculator that assumes one blended RPM across all of that will flatten the truth.
Think in blended traffic value
Performance teams should assign a traffic value by source. That value can include direct conversion value, assisted conversion value, and on-site ad revenue contribution.
A practical segmentation model looks like this:
- Organic search: Usually higher intent around content discovery, often steadier monetization behavior.
- Direct and returning users: Often more engaged, especially on content-heavy properties.
- Paid prospecting: Useful for scale, but behavior can be shallower.
- Paid retargeting: Often stronger session depth, though not always stronger ad monetization if the page path is tightly conversion-focused.
Achieving more honest media planning involves these considerations. If paid traffic helps total site revenue beyond direct purchase conversion, that traffic may deserve a higher bid ceiling than last-click reporting suggests. If it inflates pageviews but drags down monetization quality, you’ll want tighter controls.
For teams that already manage channel economics across acquisition and retention, AdStellar’s piece on media strategy and planning is a useful frame because it pushes the same discipline: don’t evaluate channels in isolation when the business outcome is blended.
Operator mindset: Treat ad inventory like another channel in your revenue mix, not a side effect of traffic.
What this changes in practice
Once you connect site monetization to paid media, better decisions follow.
You stop asking, “What does my site earn per thousand pageviews?” and start asking, “What does this traffic source contribute across purchases, ad yield, and downstream value?” That’s a stronger planning question.
It also changes campaign diagnostics. A traffic source that looks mediocre on front-end ROAS may still be worth scaling if it lifts high-quality sessions and monetizes well on-site. Another source may look efficient on clicks but weaken overall yield once you account for poor session quality.
That’s why the best website ads revenue calculator for a growth team isn’t standalone. It sits beside campaign reporting and helps you price traffic more accurately.
Actionable Tips to Increase Your Ad Revenue
Forecasting matters, but optimization is what moves the number. The best gains usually come from fixing layout, traffic quality, and session depth before chasing exotic monetization tweaks.
Placement fixes that usually matter first
- If CTR is weak, review placement before blaming demand: Ads buried too low on the page often underperform because users never reach them. Move key units into naturally viewed parts of the template and compare results.
- If RPM looks inconsistent, compare page types: Homepage, article pages, category pages, and product pages rarely monetize the same way. Treat them as separate inventory classes.
- If users bounce quickly, reduce clutter: Overloading a page can hurt engagement and lower the total number of meaningful ad exposures.
Testing habits worth keeping
- Run A/B tests on layout changes: Placement, spacing, and ad density affect both user behavior and earnings. Test one variable at a time so the result is interpretable.
- Watch viewability, not just served impressions: A slot that technically loads but rarely gets seen won’t pull its weight.
- Review device behavior separately: Mobile templates often need different spacing and sequencing than desktop.
Better monetization usually comes from cleaner execution, not just adding more units.
Content and traffic improvements
- If pages per session are soft, build stronger internal journeys: Related content modules, clearer next-step links, and tighter topical clustering can increase session depth.
- If paid traffic monetizes poorly, segment it: Don’t apply the same assumptions you use for organic visitors. Set source-specific expectations.
- If ad performance varies wildly, audit landing pages: Some templates support monetization far better than others.
For teams refining creative real estate and on-page formats, AdStellar’s guide to web banner ads is a useful practical reference because banner performance depends heavily on context, not just size.
The common thread is simple. Revenue grows when more of your traffic reaches more valuable ad experiences under better demand conditions. That’s an operational job, not a calculator setting.
Frequently Asked Questions About Ad Revenue
Can a new site use a website ads revenue calculator?
Yes, but treat the output as directional. New sites usually lack stable traffic history, so assumptions carry more weight than actual performance data. Start with conservative inputs and revise once you have enough analytics to see real engagement patterns.
Should I forecast with RPM or CTR and CPC?
Use both. RPM is better for a quick publisher-side estimate. CTR and CPC are better for diagnosing what’s driving the result. When the two views disagree, that’s often where the most useful insight lives.
How should I handle seasonal swings?
Use separate scenarios by quarter instead of one flat annual estimate. Ad revenue can fluctuate meaningfully by season, with Q4 CPMs often rising 20% to 50% due to holiday advertising spend, followed by a drop in Q1 as budgets reset, based on the earlier methodology source already referenced in this article.
What’s the biggest mistake people make?
They trust a blended average too quickly. A single sitewide number hides differences in source quality, page layout, and user intent.
If your team wants to connect paid media execution with sharper revenue decisions, AdStellar AI helps you launch, test, and scale Meta campaigns faster using historical performance, AI-driven insights, and bulk creative production built for working media buyers.