You're looking at three different ROAS figures for the same Meta campaign. Meta Ads Manager credits the conversion to a retargeting ad, Google Analytics assigns it to branded search, and your CRM ties the revenue to a lead that first arrived through an Instagram Story. None of those reports necessarily contains a technical error. Each system is answering a different question with a different view of the customer journey.
That's the operational reality of marketing attribution models. Attribution is a method for assigning conversion credit to marketing touchpoints, not a causal experiment that proves a channel created demand. The model you choose affects which campaigns appear efficient, how your team reallocates budget, and whether people trust the reporting enough to act on it.
The history explains why the confusion persists. Media mix modeling was already in use in the 1950s and became more popular in the 1980s as a top-down statistical method using aggregate data and regression. With internet advertising, last-click attribution became a common default in analytics tools in the early 2000s because it was straightforward to implement. Multi-touch and algorithmic models began appearing more widely around 2010 to 2012 as journeys spread across devices and sessions, as documented in this history of marketing attribution models.

Why Your Attribution Reports Keep Contradicting Each Other
The first mistake is treating platform reports as if they share one definition of a conversion. Meta can evaluate interactions inside its own environment and apply its configured attribution window. Google Analytics may emphasize sessions, referrals, or the final observable source. A CRM usually cares about known contacts, pipeline stages, and recorded revenue. Those systems don't see the same touchpoints, identities, or offline interactions.
Consider a paid social journey. A prospect sees a prospecting ad, returns through an organic result, clicks a retargeting ad, and later converts after searching for the brand. A last-touch report will favor the final search. A first-touch report will favor the original paid social interaction. A multi-touch model will distribute credit, but the result still depends on which events were captured and whether the systems recognized the same person across sessions and devices.
Practical rule: Treat every attribution number as a model output, not as a neutral description of reality.
The purpose of an attribution model is useful but limited. It helps a team compare touchpoints under a declared set of rules, identify patterns in conversion paths, and make budget decisions with more structure than platform intuition alone. It doesn't automatically reveal whether a conversion would have happened without the credited touchpoint.
This distinction matters when you analyze channels outside standard ad dashboards. Teams that want to interpret video performance need to understand views, retention, traffic sources, and conversions together, not just count clicks. A practical how to read YouTube analytics like a resource can help broaden that measurement discipline beyond paid social.
Before changing budgets, document three definitions: what counts as a touchpoint, which conversion event matters, and which time window applies. Then reconcile platform conversions against analytics and CRM revenue. A useful campaign performance analysis should show the source data and the attribution logic, rather than presenting one unexplained ROAS figure.
The historical shift from last-click to multi-touch and algorithmic approaches reflects a real problem. Rule-based models are easy to explain, but they impose assumptions. More complex models can represent paths more flexibly, but they require better data and often create a trust problem when stakeholders can't see why credit moved.
The Six Attribution Models Every Paid Social Marketer Should Know
Use one customer journey to understand the mechanics. Suppose a prospect sees an Instagram Story ad on Monday, clicks a Facebook carousel ad on Wednesday, watches a video ad on Thursday, clicks a retargeting ad on Friday, and converts after clicking branded search on Saturday. That gives you five touchpoints:
- Instagram Story impression
- Facebook carousel click
- Meta video view
- Meta retargeting click
- Branded search click
The models below don't discover an objective truth. They apply different rules to the same sequence.
First-touch and last-touch
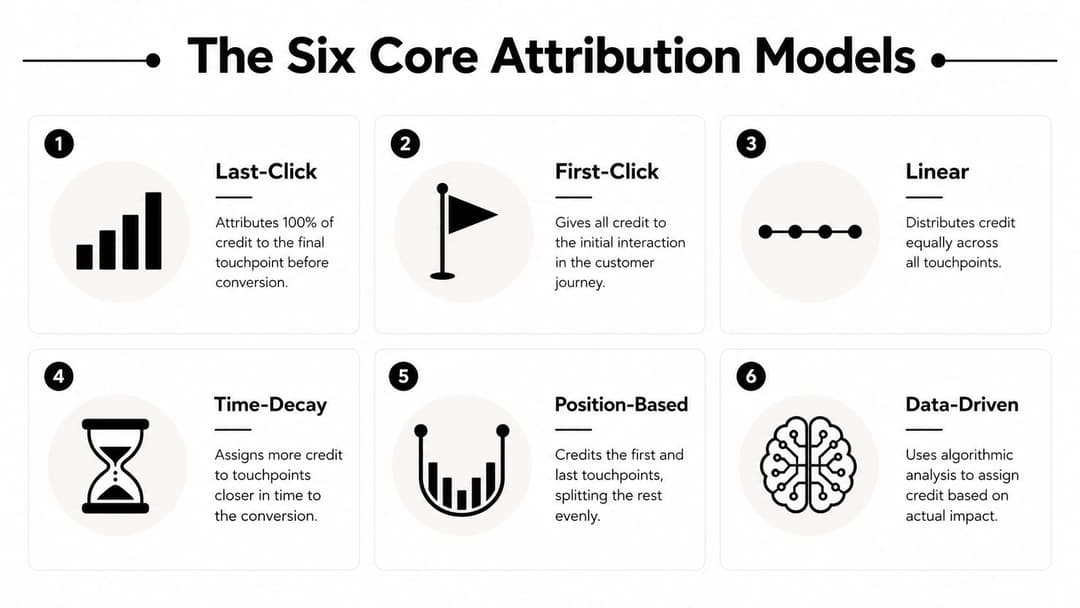
First-touch attribution assigns all conversion credit to the initial interaction. In this example, the Instagram Story receives 100%, while every later touchpoint receives zero. That makes the model useful for judging which campaigns introduce new demand, especially prospecting campaigns designed to reach people who haven't interacted with the brand.
Its weakness is obvious in a retargeting-heavy account. The first interaction may create awareness, but it doesn't tell you whether the later product education, offer, or reminder moved the buyer to act.
Last-touch attribution assigns all credit to the final measurable interaction before conversion. Branded search receives 100% in the example. This model is fast, transparent, and often useful for immediate conversion optimization, but it systematically favors demand capture. It can make branded search and retargeting look stronger than the prospecting campaigns that created the conditions for the final action.
Linear and time-decay
Linear attribution divides credit equally across all five interactions. Each touchpoint receives 20%. The logic is democratic, which makes it easy to communicate when several interactions plausibly support a purchase. It can work as a neutral baseline for longer journeys where the team doesn't have a defensible reason to favor one position.
The trade-off is that an impression, a deep product visit, and a high-intent click can receive identical credit. Linear attribution avoids one kind of bias by introducing another, because equal credit doesn't mean equal influence.
Time-decay attribution gives more credit to interactions closer to conversion. In this journey, the Friday retargeting click and Saturday branded search click would receive more credit than the Monday Story impression. The approach fits campaigns where recency often matters, such as short consideration cycles, promotions, and remarketing sequences.
It can still overvalue lower-funnel activity. A recent touchpoint may be a delivery mechanism for existing intent rather than the source of that intent.
Position-based and data-driven
Position-based attribution, often called U-shaped attribution, emphasizes the first and last interactions. A common implementation gives the opening touch and closing touch the largest shares, then divides the remainder among the middle interactions. For this journey, Instagram Story and branded search would receive the strongest credit, while the carousel, video, and retargeting interactions would receive smaller shares.
This model is a practical compromise when demand-generation and conversion teams need both parts of the journey represented. Its weakness is that the first and last positions are important by assumption, not because the model has proved their incremental effect.
Data-driven attribution uses observed conversion paths and algorithmic analysis to estimate how touchpoints relate to outcomes. In theory, it can identify interactions that rule-based models overlook, including channel combinations and path differences. In practice, it depends on clean event collection, consistent identity resolution, enough conversion history, and a reporting process stakeholders can understand.
The academic literature reflects the industry's movement toward statistically driven methods. A review covering 1990 to 2019 found that about 67% of published attribution-modelling articles appeared from 2014 to 2019, with Markov chain models the most frequently used approach in the surveyed papers at 18%. Those figures come from the literature review of attribution modelling, not from a guarantee that an algorithmic model will improve a particular ad account.
For a broader treatment of path-based methods, this guide to multi-touch attribution is useful background. When you connect these models to a wider digital commerce analytics workflow, keep the business question visible. A model that helps creative testing may not be suitable for annual channel allocation.
Which Attribution Model Fits Your Campaign Strategy
There isn't a universally best attribution model. The right choice depends on what you're trying to learn, how much of the journey you can observe, and whether your campaigns create demand or capture demand that already exists.
First-touch makes sense for prospecting analysis. If the question is which campaign introduces qualified people to the brand, giving full credit to the first known interaction provides a clear lens. It becomes misleading when used to judge retargeting or conversion campaigns, because those campaigns rarely initiate the journey.
Last-touch works well as a tactical baseline for short, direct conversion paths. It helps a media buyer decide which ads close tracked actions today. It doesn't work as the only budget-allocation model when upper-funnel campaigns influence later searches, direct visits, or returning users.
Linear attribution offers a reasonable starting point when the team wants to avoid positional bias and the journey includes several meaningful interactions. It becomes less useful when touchpoints vary sharply in intent. Equal credit for a passive impression and a product demonstration can obscure the decisions a marketer needs to make.
Time decay suits campaigns with a clear recency effect, including promotional e-commerce and active remarketing. Position-based attribution is easier to defend when executives want to see both demand creation and conversion capture in one report. Data-driven models deserve consideration only after the organization has reliable data coverage and enough observed paths to support the method.
| Model | Best For | Data Requirements | Implementation Complexity | Key Limitation |
|---|---|---|---|---|
| First-touch | Prospecting and demand creation | First known interaction | Low | Ignores nurture and closing activity |
| Last-touch | Immediate conversion optimization | Final measurable interaction | Low | Favors lower-funnel channels |
| Linear | Baseline analysis across longer journeys | Multiple recorded touchpoints | Low to moderate | Assumes equal influence |
| Time-decay | Promotions and recent conversion activity | Timestamped interactions | Moderate | Can overvalue retargeting |
| Position-based | Balancing acquisition and conversion teams | Reliable first and last touchpoints | Moderate | Uses arbitrary positional emphasis |
| Data-driven | High-volume, mature measurement programs | Broad, clean path and outcome data | High | Harder to audit and explain |
Meta's walled-garden reporting adds another constraint. A model may be perfectly consistent inside Meta while remaining incomplete across Google, CRM, email, organic search, and offline sales activity. That's why media mix modeling can become a better complement when the business question concerns aggregate channel contribution rather than the exact user path.
For most paid social teams, the practical answer is not replacing last-click overnight. Keep it as a reference point, add one model aligned with the campaign objective, and study where the conclusions diverge. Those divergences are often more valuable than the single blended score.
Why Most Attribution Implementations Fail in Practice
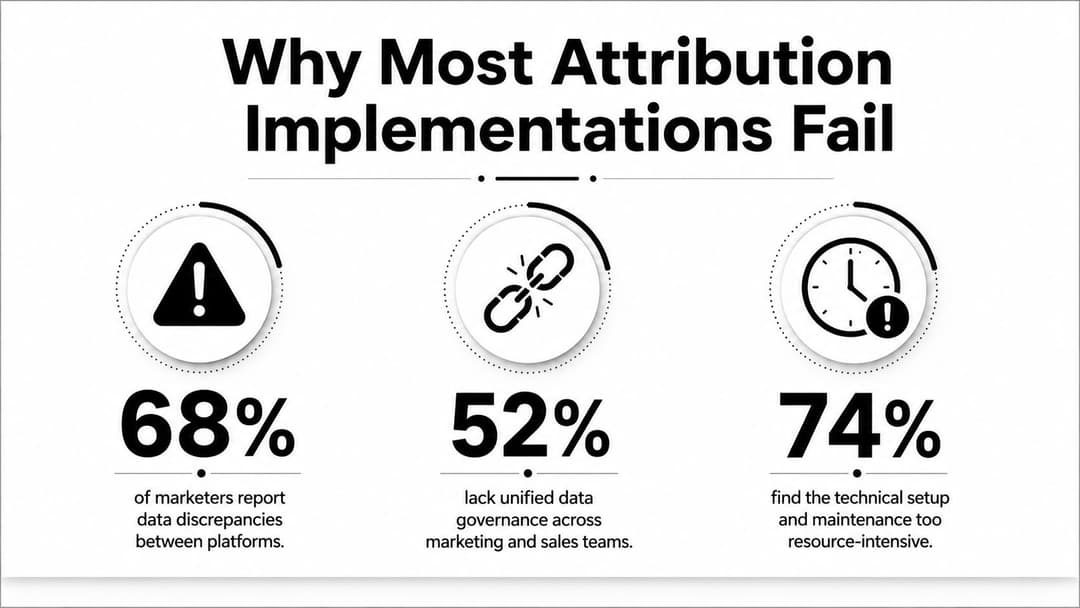
Attribution projects usually fail in the operating layer. The model may be statistically coherent, but the team can't connect identities, collect complete touchpoints, reconcile revenue, or agree on how the output should affect budgets.
MMA Global's benchmark shows the gap clearly. 81% of marketing organizations either use multi-touch attribution or plan to use it, yet users report that only 31% of media budget is measured by MTA. The same benchmark reports an MTA solution ROI of 7%, says more than one in three companies in implementation had already failed at least once, and identifies lack of evidence of value as a reason for non-adoption at 29%. These figures come from the MMA Global State of Multi-Touch Attribution benchmark.
The data problems arrive first
A Meta account can contain reliable click data while your broader customer journey remains fragmented. Browser restrictions, consent choices, cross-device behavior, missing UTM parameters, offline conversations, and platform-specific identity graphs all create blind spots. When the model sees only the trackable portion, it may reward the channel with the cleanest data rather than the channel with the greatest commercial influence.
Identity resolution is especially important for paid social. A prospect may view an ad on a phone, research on a laptop, and submit a form after returning through a different source. If the system can't connect those events, it treats one journey as several incomplete journeys.
Governance determines whether anyone believes the output
Different teams often define “conversion” differently. Meta may count a platform-attributed action, analytics may count a session conversion, and the CRM may count qualified pipeline or closed revenue. Without a shared event definition, naming taxonomy, attribution window, and owner for data quality, every meeting becomes an argument about whose dashboard is right.
The model can't repair a disagreement about what the business is measuring.
Start with a narrow scope. Connect the channels that materially influence the decision you need to make, define the revenue event, and show the output beside the existing report. A limited, trusted system usually creates more value than a full-funnel implementation that no one can validate.
How to Choose and Test Your First Attribution Model
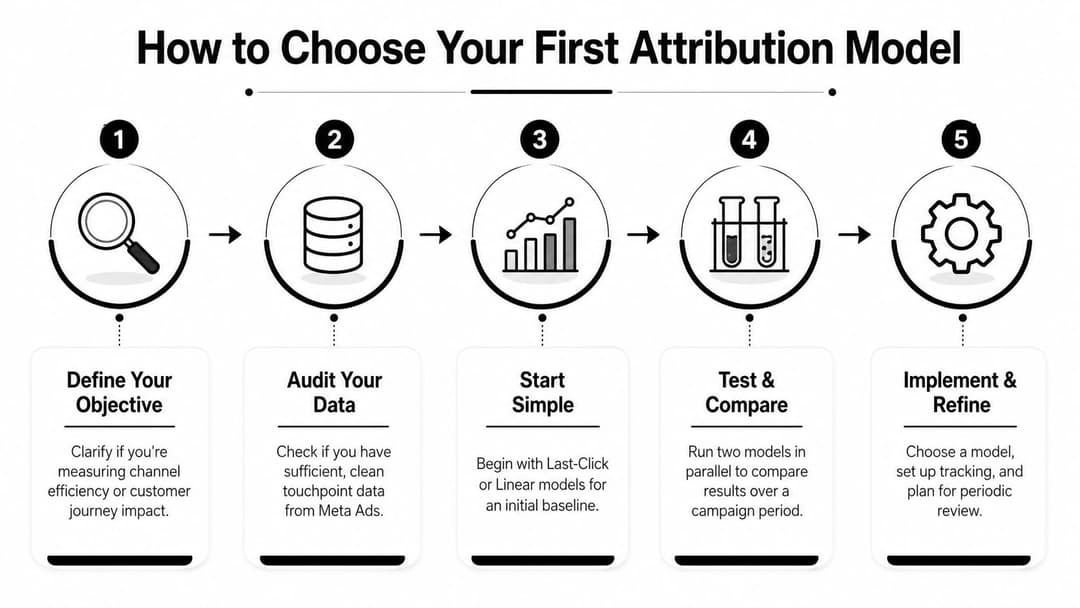
Begin with the decision, not the software. Ask whether you need to evaluate channel efficiency, understand the customer journey, improve creative allocation, or estimate the effect of changing total media investment. Each question can require a different measurement approach.
Define the first test boundary
Choose a small set of channels with a clear relationship to the decision. For a paid social team, that might mean Meta, Google, and the CRM conversion record. Don't attempt to stitch every email, affiliate, organic, offline, and partner interaction into the first release if your team can't verify the underlying data.
Then audit the inputs:
- Conversion definition: Select one business outcome, such as a qualified lead, purchase, or recorded revenue event.
- Touchpoint coverage: List the events your system captures and identify the interactions it cannot observe.
- Identity logic: Document how anonymous sessions become known contacts and how cross-device activity is handled.
- Naming rules: Standardize campaign, source, medium, creative, and audience fields before comparing results.
Run models in parallel
Keep the current last-click report intact. Add one alternative, usually linear or position-based, and run both over the same campaign period. Compare channel rankings, conversion-path patterns, revenue reconciliation, and the budget recommendations each model would produce.
A model is actionable when it produces stable patterns that match observed business behavior and helps the team choose a different action. It is noise when small data changes cause major swings, the output can't be reconciled to revenue, or the model's recommendations conflict with every controlled test you have.
Use stakeholder checkpoints rather than presenting a mysterious final score. First, have the media buyer verify campaign mappings. Next, have analytics verify event logic. Then have finance or revenue operations verify the conversion and revenue totals. For teams planning controlled experiments, the sample size for testing matters because an underpowered test can create false confidence in either the model or the channel.
Expand only after trust is earned
Once the narrow test works, add another channel or conversion stage. Record every assumption, gap, and change. Your goal isn't to create a perfect customer graph. It's to create a measurement system that is transparent enough for people to use and limited enough for the data to support.
When Attribution Isn't Enough, the Case for Incrementality Testing
A branded search ad can receive last-touch credit after a customer has already decided to buy. Retargeting often creates the same distortion. The ad appears late in the journey, reaches an already motivated user, and gets credit for an outcome that may have occurred without the campaign.
Attribution asks, which touchpoints received credit? Incrementality asks, did the marketing activity cause additional conversions that would not have happened otherwise? Those questions overlap, but they answer different operational problems.
Incrementality testing addresses that problem by comparing an exposed group with a valid control or holdout group. The test can use an audience, geography, or another defensible unit, depending on the channel and business. The key comparison is against the expected outcome without the campaign, rather than the way credit is distributed across observed touchpoints. For setup details, see a practical guide to control-group testing.
Recent experiment comparisons summarized by Nico Neumann report that last-click attribution matched the same budget decision as an experiment in about 84% of cases, while model-based predicted incrementality reached about 90%. The same source reports that only about 69% of conversions credited by last-click were incremental on average, with results varying by vertical, roughly 76% in e-commerce, 63% in retail, and 48% in travel. The findings appear in this summary of attribution and causal-inference comparisons.
Attribution is a diagnostic map. A holdout test checks whether the road changed the destination.
Privacy changes increase the measurement gap. Reduced deterministic tracking and the loss of third-party cookies weaken cross-platform user-level measurement, so platform-reported ROAS may omit part of the customer path. The practical difference between correlation and causation is examined in this comparison of attribution and incrementality.
Use attribution to identify candidates for testing, then use holdouts to validate scaling decisions. Use MMM when the question concerns aggregate channel contribution that user-level tracking cannot reliably connect. Current 2026 coverage reports multi-touch adoption at 47%, up from 31% in 2023, and MMM investment at 26%, up from 9% in 2023, while another 2026 dataset reports that 40% of marketers invest in MMM. These figures show growing interest in combining methods, not that one method has replaced the others, as reported in this 2026 attribution statistics overview.
Your 90-Day Attribution Implementation Roadmap
Use the first four weeks to establish the foundation. Reconcile Meta, analytics, and CRM conversion definitions, audit campaign tagging, map the identity process, and select one narrow channel scope. Choose a baseline model and write down its assumptions before anyone reviews the output.
During weeks five through eight, run the baseline and alternative model in parallel. Compare channel rankings, revenue reconciliation, path coverage, and the budget decisions each model would recommend. Ask media, analytics, and revenue teams to challenge the inputs separately, then document the explanations they accept.
Use weeks nine through twelve to decide whether the model is ready for operational use. If the output is stable, understandable, and useful for a specific decision, formalize ownership and review it on a recurring basis. If the model remains brittle or incomplete, keep the simpler baseline and add an incrementality test instead of expanding the implementation.
Watch for warning signs: unexplained revenue gaps, sudden credit shifts, platform mappings no one can explain, and stakeholders selecting whichever model flatters their channel. Those are governance failures, not reasons to buy a more complex algorithm.
AdStellar AI connects Meta campaign creation, testing, and performance analysis in one workspace, and its native Cometly integration supports server-side attribution tracking that links ad performance to revenue. If you're building a more disciplined measurement process for creative, audience, and campaign decisions, visit AdStellar AI to see how the platform fits into your workflow.